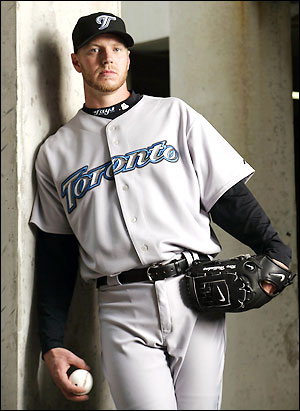
So word is that coveted Toronto Blue Jays ace Roy Halladay is willing to waive his no-trade clause for a deal to the Yankees.
Bring it on.
Wait. This from a small market fan? Sick of the Yankees making it rain with 100 dollar bills to the tune of a $200 Million payroll?
Yeah, you heard me. Bring it on.
The system is broken. It's been broken for a long time. Some could say it's been broken for a century. But it's difficult to fix a broken system when the Yankees aren't winning World Series after World Series.
The past decade has only added to the argument that money can't buy championships. That small market teams can compete. That there's parity in baseball.
It's all B.S. The Yankees can buy championships. They've simply made some horrendous moves during the past decade covered up by some good ones. But that's a luxury you can afford when you seemingly have no budget.
Want to prove to the world that the system needs fixing? Trade for Roy Halladay.
The Yankees are the perfect suitor, to be honest. They can pay the $15+ Million salary. They don't care about the money. They can send only prospects and young underachieving players in return, players they have no use for anyway.
And let's be real, this is more than trading for a star pitcher in the final year of his contract. Halladay would essentially be signing his 2010 free agent deal by approving such a trade. If he succeeds with the Yankees, do you really think they'd let him leave the Bronx? Of course not. They'll spend whatever it takes.
So trade for Halladay. Sign Lackey. Sign and trade for every other big money, big name star that other teams know they can't afford now or won't be able to afford soon. Take advantage of all of those poor saps.
Create a $250 Million payroll. Win 125 games. Sweep through the playoffs.
You laugh. Think it can't happen. But it can. With the new revenue generating stadium in New York, it certainly can. The Yankees have no limits. While many of the top tier teams are trimming payroll, the Yankees can eat up the debris.
Then? Then can we admit there's a problem? Then can we do something about it?
I'm willing to suffer through a couple of years of Yankee super dominance to get something done. Until now, they've stumbled and bumbled through Kevin Brown, Jason Giambi, Roger Clemens, Johnny Damon, Kei Igawa, Gary Sheffield, Carl Pavano and other similar bad signings only to remain competitive by signing players like Alex Rodriguez, Derek Jeter, CC Sabathia and others.
Stop screwing up, Yankees. Make some good signings. Sign the best players. Trade for the stars that the poor small market teams can't afford.
Dominate. Dominate hard. Dominate like no team has ever dominated before. Make the other teams scream for mercy.
And change.
Showing posts with label Major League Baseball. Show all posts
Sunday, November 29, 2009
Sports: Halladay open to joining the Dark Side
1 comments
Sunday, November 29, 2009
Posted by
Jon Loomer
Labels: Major League Baseball, New York Yankees, Roy Halladay
|
Sports: Selig's departure could spark needed change
|
It was recently revealed that Bud Selig has declined an option to renew his contract that currently ends in 2012 and will step down as Commissioner of Major League Baseball.
Here is where you expect me to rag on Selig for ruining the league, causing the steroid issues, and failing to institute a salary cap.
Eh.
It's easy to hate on Selig. He's a weaselly guy. He has a crooked smile. Drools and spits when he talks. Was in charge when baseball endured the strike of 1994, the Steroid Era and growing divide between the haves and have-nots.
But I don't lay it all on Selig. He truly does care about baseball. But I don't think it would have been any different under just about any other of the league's prior commissioners.
Selig wasn't the cause of this stuff. He was simply in charge when it happened.
Could he have done something about it? Maybe. But he was a weak leader. He was diplomatic and Democratic. He deferred to management and yielded to the Player's Association in an effort to keep everyone happy.
The ability to get two sides to work together is often seen as a sign of a good leader. But it's not the type of leader the game needed during the past 15 years. And it's not the type of leader it needs now.
He was also a progressive Commissioner, being the center of inter-league play and the Wild Card playoff system.
Are those things good for baseball? Debatable. But the league is thriving, more or less, and he deserves some credit.
Baseball now needs a strong leader. One who isn't afraid of ruffling feathers. One who is willing to institute the "Good of the Game" clause that Selig was all too scared to touch.
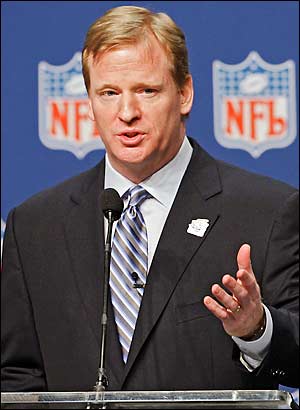
In many ways, baseball needs its Roger Goodell. The new NFL commissioner jumped in and made immediate changes to the league's image. He is brash. He is confident. He does what he knows is best, regardless of what others think.
Baseball needs a commissioner who is not afraid of the MLBPA. One who is willing to do what is best for the league, no matter what the players and owners think. One who takes the power away from the players and Yankees and returns it to the game.
The steroids issue needs to be put to rest. It can't be until the league is completely transparent about the past and willing to go above and beyond to make sure that performance enhancing drugs stay out. And those who use need to be punished severely.
Selig has been weak here. He played dumb. No matter what the testing system in place, he'd claim it was working. He publicly trusted the players. He didn't want to punish those who broke the rules.
Instead of a public leader, he was a PR head. Cheerleader. Nothing to see here. All is well. Best league in the world.
Test more often. Off-season, preseason, during the season. Keep tests. Allow them to be public. Retest when codes are broken.
Do something about the financial disparity in the game. Get your head out of the sand. We all know that it is a problem. Admit to it. Don't allow the Yankees to guide your decisions.
Is a salary cap the answer? I don't know. But do something. Do more than a tax that does nothing but encourage the have-nots to collect year after year.
I don't fault Selig for the flaws in today's game. I wish he would have been a stronger leader. But he wasn't.
Knowing that his reign is ending gives me hope. It gives baseball hope. It gives fans of small market teams hope.
The next guy may or may not be any better. But new leadership provides hope that things can change. Under Selig, they won't.
Here is where you expect me to rag on Selig for ruining the league, causing the steroid issues, and failing to institute a salary cap.
Eh.
It's easy to hate on Selig. He's a weaselly guy. He has a crooked smile. Drools and spits when he talks. Was in charge when baseball endured the strike of 1994, the Steroid Era and growing divide between the haves and have-nots.
But I don't lay it all on Selig. He truly does care about baseball. But I don't think it would have been any different under just about any other of the league's prior commissioners.
Selig wasn't the cause of this stuff. He was simply in charge when it happened.
Could he have done something about it? Maybe. But he was a weak leader. He was diplomatic and Democratic. He deferred to management and yielded to the Player's Association in an effort to keep everyone happy.
The ability to get two sides to work together is often seen as a sign of a good leader. But it's not the type of leader the game needed during the past 15 years. And it's not the type of leader it needs now.
He was also a progressive Commissioner, being the center of inter-league play and the Wild Card playoff system.
Are those things good for baseball? Debatable. But the league is thriving, more or less, and he deserves some credit.
Baseball now needs a strong leader. One who isn't afraid of ruffling feathers. One who is willing to institute the "Good of the Game" clause that Selig was all too scared to touch.
In many ways, baseball needs its Roger Goodell. The new NFL commissioner jumped in and made immediate changes to the league's image. He is brash. He is confident. He does what he knows is best, regardless of what others think.
Baseball needs a commissioner who is not afraid of the MLBPA. One who is willing to do what is best for the league, no matter what the players and owners think. One who takes the power away from the players and Yankees and returns it to the game.
The steroids issue needs to be put to rest. It can't be until the league is completely transparent about the past and willing to go above and beyond to make sure that performance enhancing drugs stay out. And those who use need to be punished severely.
Selig has been weak here. He played dumb. No matter what the testing system in place, he'd claim it was working. He publicly trusted the players. He didn't want to punish those who broke the rules.
Instead of a public leader, he was a PR head. Cheerleader. Nothing to see here. All is well. Best league in the world.
Test more often. Off-season, preseason, during the season. Keep tests. Allow them to be public. Retest when codes are broken.
Do something about the financial disparity in the game. Get your head out of the sand. We all know that it is a problem. Admit to it. Don't allow the Yankees to guide your decisions.
Is a salary cap the answer? I don't know. But do something. Do more than a tax that does nothing but encourage the have-nots to collect year after year.
I don't fault Selig for the flaws in today's game. I wish he would have been a stronger leader. But he wasn't.
Knowing that his reign is ending gives me hope. It gives baseball hope. It gives fans of small market teams hope.
The next guy may or may not be any better. But new leadership provides hope that things can change. Under Selig, they won't.
Tuesday, November 24, 2009
Sports: Time to Throw out the Voters
0
comments
Tuesday, November 24, 2009
Posted by
Jon Loomer
Labels: Major League Baseball, Miguel Cabrera, MVP, Voters
|
Now... What I'm about to say is going to be controversial. That's how you write a blog that gets attention. So, everyone...
Controversy Alert! About to say something that many will think is stupid, thus guaranteeing comments and traffic!
It's time to get rid of Major League Baseball award voters.
There, I said it.
Crazy, right? Insanity. Stupid. Look at where the BCS system got us. Reason number one why this is a dumb idea.
Wrong.
What reasons do people give for why a player deserves an MVP?
Stats.
What reasons do people give when they complain about a dumb vote?
Stats.
How often do voters misuse their power by, say, voting for Miguel Cabrera for AL MVP? Or for giving Jeremy Affeldt a 10th place vote for NL MVP?
Far too often.
You can question a voter's intentions. You can question a voter's loyalty. You can question a voter's intelligence.
Far too often, a voter leans towards the players he covers. A voter omits a player based on grudges. A voter penalizes a player he rarely got to watch. A voter is swayed by media attention and public perception
But stats have no bias.
Granted, stats don't measure if a player was a cancer in the clubhouse. They don't measure if a player was a leader. They don't measure whether the player was involved in a pennant race (well, they probably could).
But subjectivity is part of the problem. Jeremy Affeldt? Jeremy freaking Affeldt? What reason do you have for giving that guy a vote?
I'd take the statistical alternative -- the hard evidence and substantiated selection -- over the status quo. The current system has room for error. Room for impropriety. Room for corruption.
What's that? Corruption? Yeah, corruption. Players get paid based on their awards.
Guess what? That first place Cabrera vote earned him a bonus he otherwise would not have received. Not saying there's a connection. Just saying the opportunity is there.
I'm also tired of the "he was involved in a pennant race" argument. So? So that makes him more valuable? A player surrounded by no talent performing like Superman is less valuable than, say, Ryan Howard on the Phillies?
Purely hypothetical. One player does not carry a team in baseball. He just doesn't. He can't. He helps. But he helps, mainly, by putting up good stats.
And these days, throwing out the "involved in a pennant race" criteria makes more sense than ever. It wasn't too long ago that franchises had largely similar resources to work with.
More parity existed. One player could make all the difference in the world. Including that factor made some sense, at least when separating two players with similar numbers.
Now? Now you can't fault a player for having the greatest statistical season on the worst team. You can't automatically anoint the MVP only from a group of teams that participated in the playoffs.
For many reasons. If a player was on a team that made the playoffs with 83 wins, was he more valuable than an equal player on a team in a difficult division that missed the playoffs with 85 wins? Of course not. But many will argue it to be the case.
It's not right. You are bound to ignore great seasons and favor the big markets. The markets that can buy a World Series. Can buy a playoff appearance. And then, can buy an MVP.
Isn't this, then, all the more reason for a player to sign with a big market team? Not only will they get the most money, but they'll have the best chance to play in the World Series and win an MVP award.
Why play for a small market team? What is left? The folksy people?
I understand continuing to involve fans in All-Star voting, even if it leads to flawed results. I get that. But why do we need to involve writers?
Screw writers.
So throw out the voters. Base it on the stats. Leave it to a computer. People will still find ways to argue, don't get me wrong. But the deserving player, more often than not, will get properly recognized. Not only the winner, but second, third place on down.
I'm not going to try too hard to create the formula to be used for this. I'll just get myself into trouble by developing a flawed formula. Smarter people need to do that (Bill James?).
But many formulas have already been created to measure performance. I'd prefer to go with any number of formulas over a voter who is likely to use stats (often incorrectly) and bias to make their decision.
Bonus money depends on it.
Controversy Alert! About to say something that many will think is stupid, thus guaranteeing comments and traffic!
It's time to get rid of Major League Baseball award voters.
There, I said it.
Crazy, right? Insanity. Stupid. Look at where the BCS system got us. Reason number one why this is a dumb idea.
Wrong.
What reasons do people give for why a player deserves an MVP?
Stats.
What reasons do people give when they complain about a dumb vote?
Stats.
How often do voters misuse their power by, say, voting for Miguel Cabrera for AL MVP? Or for giving Jeremy Affeldt a 10th place vote for NL MVP?
Far too often.
You can question a voter's intentions. You can question a voter's loyalty. You can question a voter's intelligence.
Far too often, a voter leans towards the players he covers. A voter omits a player based on grudges. A voter penalizes a player he rarely got to watch. A voter is swayed by media attention and public perception
But stats have no bias.
Granted, stats don't measure if a player was a cancer in the clubhouse. They don't measure if a player was a leader. They don't measure whether the player was involved in a pennant race (well, they probably could).
But subjectivity is part of the problem. Jeremy Affeldt? Jeremy freaking Affeldt? What reason do you have for giving that guy a vote?
I'd take the statistical alternative -- the hard evidence and substantiated selection -- over the status quo. The current system has room for error. Room for impropriety. Room for corruption.
What's that? Corruption? Yeah, corruption. Players get paid based on their awards.
Guess what? That first place Cabrera vote earned him a bonus he otherwise would not have received. Not saying there's a connection. Just saying the opportunity is there.
I'm also tired of the "he was involved in a pennant race" argument. So? So that makes him more valuable? A player surrounded by no talent performing like Superman is less valuable than, say, Ryan Howard on the Phillies?
Purely hypothetical. One player does not carry a team in baseball. He just doesn't. He can't. He helps. But he helps, mainly, by putting up good stats.
And these days, throwing out the "involved in a pennant race" criteria makes more sense than ever. It wasn't too long ago that franchises had largely similar resources to work with.
More parity existed. One player could make all the difference in the world. Including that factor made some sense, at least when separating two players with similar numbers.
Now? Now you can't fault a player for having the greatest statistical season on the worst team. You can't automatically anoint the MVP only from a group of teams that participated in the playoffs.
For many reasons. If a player was on a team that made the playoffs with 83 wins, was he more valuable than an equal player on a team in a difficult division that missed the playoffs with 85 wins? Of course not. But many will argue it to be the case.
It's not right. You are bound to ignore great seasons and favor the big markets. The markets that can buy a World Series. Can buy a playoff appearance. And then, can buy an MVP.
Isn't this, then, all the more reason for a player to sign with a big market team? Not only will they get the most money, but they'll have the best chance to play in the World Series and win an MVP award.
Why play for a small market team? What is left? The folksy people?
I understand continuing to involve fans in All-Star voting, even if it leads to flawed results. I get that. But why do we need to involve writers?
Screw writers.
So throw out the voters. Base it on the stats. Leave it to a computer. People will still find ways to argue, don't get me wrong. But the deserving player, more often than not, will get properly recognized. Not only the winner, but second, third place on down.
I'm not going to try too hard to create the formula to be used for this. I'll just get myself into trouble by developing a flawed formula. Smarter people need to do that (Bill James?).
But many formulas have already been created to measure performance. I'd prefer to go with any number of formulas over a voter who is likely to use stats (often incorrectly) and bias to make their decision.
Bonus money depends on it.
Monday, November 9, 2009
Sports: Money Doesn't Guarantee Success, BUT...
0
comments
Monday, November 09, 2009
Posted by
Jon Loomer
Labels: Major League Baseball, New York Yankees, Payroll, Salary Cap
|
In my never ending quest to spotlight the gross economic inequities in Major League Baseball, today I'm going to show the direct relationship between money and success.
Before now, I've focused instead on the lack of parity in baseball compared to the NBA and NFL. Additionally, we snapped our fingers and observed what baseball would look like if it mimicked the NBA's financial disparities.
Still, we've yet to show the direct correlation between money and success (as obvious as it may otherwise seem). So let's do that.
We know that money does not guarantee success. And not spending huge sums of money will not guarantee failure. Particularly covering a one or two year time frame.
However, over a five or 10 year period, I'm confident that we can reasonably expect that the vast majority of teams that succeed have spent money and the vast majority of teams that fail will spend the least.
Below is a chart of all teams during the past 10 years, their record, win/loss rank, average payroll, and payroll rank.
Let's talk about what this means. As I've said before, spending money offers no guarantees. Some teams will spend money and fail because of poor decisions. Other teams will not spend money and find other ways to succeed.
In my opinion (though this is far from scientific), you can reasonably expect your spending rank and winning percentage rank to be close to one another, falling within about 10 spots of one another.
As you can see by the chart above, seven teams were able to fall outside of that expected range. Three teams (Oakland, Minnesota and Florida) have been able to succeed far above their expected rate despite a lack of significant spending.
Three other teams (New York Mets, Chicago Cubs, Detroit Tigers and Baltimore Orioles) prove that spending money must be complemented by sound decisions. These teams fell far below their expected rate of success.
Just as important as these results is that the two teams that spent the most money during the past 10 years (New York Yankees and Boston Red Sox) are also the two teams with the best winning percentages during that time.
Coincidence? I think not.
The Yankees also had the highest payroll in each of those 10 years. In fact, they've had the highest payroll in all but three seasons dating back to 1993, and in each of those three seasons they finished in the top three.
While we've previously talked about the appearance of more parity in baseball during the past five seasons, that isn't true in this study. Here are the stats for the past five years:
This time, there are only five teams that fall outside of their expected window of success. The Twins, Indians and Marlins found ways to succeed beyond their payroll while the Mariners and Orioles have failed despite shelling out large dollars.
Also, three of the top four in spending (the Mets excluded) have had the three best winning percentages during the past five years.
Are teams that spend money guaranteed to succeed? No, but the likelihood is much greater that they will.
Are teams that don't spend large sums of money guaranteed to fail? No, but they are not able to build teams the way that big spenders can and must get creative to exceed expectations.
In either case, the outliers are rare exceptions. During the past 10 years, 23 of the 30 teams have win/loss and spending ranks that fall within a +/- 10 rank window. During the past five years, 25 teams qualify.
While spending money wisely should be a factor in resultant success, the amount of spending should not be a determinant.
Unfortunately, that's currently the case. Without a salary cap or other structure to modify the current payroll disparity, a minority of teams will continue to spend more to give them a built-in advantage.
Before now, I've focused instead on the lack of parity in baseball compared to the NBA and NFL. Additionally, we snapped our fingers and observed what baseball would look like if it mimicked the NBA's financial disparities.
Still, we've yet to show the direct correlation between money and success (as obvious as it may otherwise seem). So let's do that.
We know that money does not guarantee success. And not spending huge sums of money will not guarantee failure. Particularly covering a one or two year time frame.
However, over a five or 10 year period, I'm confident that we can reasonably expect that the vast majority of teams that succeed have spent money and the vast majority of teams that fail will spend the least.
Below is a chart of all teams during the past 10 years, their record, win/loss rank, average payroll, and payroll rank.
| Team | 10 yr % | $ Avg | W/L Rank | $ Rank | Diff |
| NY Yankees | .598 | $167,123,746 | 1 | 1 | 0 |
| Boston | .568 | $116,826,442 | 2 | 2 | 0 |
| St. Louis | .564 | $83,161,682 | 3 | 9 | 6 |
| LA Angels | .556 | $88,366,382 | 4 | 7 | 3 |
| Atlanta | .551 | $92,756,206 | 5 | 5 | 0 |
| Oakland | .550 | $52,293,616 | 6 | 24 | 18 |
| LA Dodgers | .532 | $100,205,132 | 7 | 4 | -3 |
| Minnesota | .532 | $50,235,304 | 7 | 25 | 18 |
| San Francisco | .529 | $78,967,826 | 9 | 11 | 2 |
| Chicago Sox | .529 | $77,392,133 | 10 | 12 | 2 |
| Philadelphia | .525 | $79,506,314 | 11 | 10 | -1 |
| Seattle | .517 | $88,143,915 | 12 | 8 | -4 |
| Houston | .514 | $77,137,108 | 13 | 13 | 0 |
| Cleveland | .504 | $65,073,842 | 14 | 19 | 5 |
| NY Mets | .504 | $108,669,499 | 14 | 3 | -11 |
| Florida | .502 | $35,286,529 | 16 | 30 | 14 |
| Chicago Cubs | .499 | $90,704,693 | 17 | 6 | -11 |
| Toronto | .497 | $67,931,916 | 18 | 18 | 0 |
| Arizona | .497 | $73,153,640 | 19 | 16 | -3 |
| Texas | .479 | $75,197,417 | 20 | 15 | -5 |
| Colorado | .474 | $60,999,990 | 21 | 20 | -1 |
| San Diego | .474 | $54,458,302 | 22 | 22 | 0 |
| Cincinnati | .464 | $58,340,608 | 23 | 21 | -2 |
| Milwaukee | .458 | $52,893,517 | 24 | 23 | -1 |
| Detroit | .450 | $76,179,991 | 25 | 14 | -11 |
| Washington | .439 | $46,455,467 | 26 | 27 | 1 |
| Baltimore | .432 | $71,776,769 | 27 | 17 | -10 |
| Tampa Bay | .429 | $40,130,874 | 28 | 29 | 1 |
| Pittsburgh | .421 | $43,445,782 | 29 | 28 | -1 |
| Kansas City | .415 | $47,399,533 | 30 | 26 | -4 |
Let's talk about what this means. As I've said before, spending money offers no guarantees. Some teams will spend money and fail because of poor decisions. Other teams will not spend money and find other ways to succeed.
In my opinion (though this is far from scientific), you can reasonably expect your spending rank and winning percentage rank to be close to one another, falling within about 10 spots of one another.
As you can see by the chart above, seven teams were able to fall outside of that expected range. Three teams (Oakland, Minnesota and Florida) have been able to succeed far above their expected rate despite a lack of significant spending.
Three other teams (New York Mets, Chicago Cubs, Detroit Tigers and Baltimore Orioles) prove that spending money must be complemented by sound decisions. These teams fell far below their expected rate of success.
Just as important as these results is that the two teams that spent the most money during the past 10 years (New York Yankees and Boston Red Sox) are also the two teams with the best winning percentages during that time.
Coincidence? I think not.
The Yankees also had the highest payroll in each of those 10 years. In fact, they've had the highest payroll in all but three seasons dating back to 1993, and in each of those three seasons they finished in the top three.
While we've previously talked about the appearance of more parity in baseball during the past five seasons, that isn't true in this study. Here are the stats for the past five years:
| Team | 5 yr % | $ Avg | W/L Rank | $ Rank | Diff |
| NY Yankees | .590 | $200,627,941 | 1 | 1 | 0 |
| LA Angels | .586 | $108,674,798 | 2 | 4 | 2 |
| Boston | .577 | $128,353,439 | 3 | 2 | -1 |
| Philadelphia | .552 | $96,899,494 | 4 | 10 | 6 |
| St. Louis | .541 | $89,702,917 | 5 | 13 | 8 |
| Minnesota | .533 | $62,650,708 | 6 | 22 | 16 |
| Chicago Sox | .529 | $100,771,666 | 7 | 7 | 0 |
| NY Mets | .527 | $120,957,962 | 8 | 3 | -5 |
| LA Dodgers | .519 | $101,788,768 | 9 | 6 | -3 |
| Cleveland | .510 | $63,951,300 | 10 | 20 | 10 |
| Detroit | .510 | $99,931,115 | 10 | 8 | -2 |
| Chicago Cubs | .507 | $106,856,519 | 12 | 5 | -7 |
| Atlanta | .507 | $92,599,372 | 13 | 11 | -2 |
| Toronto | .507 | $75,581,900 | 13 | 15 | 2 |
| Milwaukee | .505 | $65,921,933 | 15 | 18 | 3 |
| Oakland | .503 | $61,462,581 | 16 | 24 | 8 |
| Houston | .499 | $89,803,266 | 17 | 12 | -5 |
| Florida | .498 | $32,911,967 | 18 | 30 | 12 |
| Texas | .494 | $65,657,492 | 19 | 19 | 0 |
| Colorado | .492 | $57,533,700 | 20 | 25 | 5 |
| San Diego | .490 | $61,741,871 | 21 | 23 | 2 |
| Arizona | .488 | $62,760,063 | 22 | 21 | -1 |
| San Francisco | .472 | $85,937,185 | 23 | 14 | -9 |
| Seattle | .470 | $99,749,130 | 24 | 9 | -15 |
| Cincinnati | .465 | $67,876,655 | 25 | 17 | -8 |
| Tampa Bay | .463 | $39,270,833 | 26 | 29 | 3 |
| Baltimore | .426 | $74,870,527 | 27 | 16 | -11 |
| Washington | .424 | $52,872,200 | 28 | 27 | -1 |
| Pittsburgh | .409 | $44,154,273 | 29 | 28 | -1 |
| Kansas City | .404 | $56,011,267 | 30 | 26 | -4 |
This time, there are only five teams that fall outside of their expected window of success. The Twins, Indians and Marlins found ways to succeed beyond their payroll while the Mariners and Orioles have failed despite shelling out large dollars.
Also, three of the top four in spending (the Mets excluded) have had the three best winning percentages during the past five years.
Are teams that spend money guaranteed to succeed? No, but the likelihood is much greater that they will.
Are teams that don't spend large sums of money guaranteed to fail? No, but they are not able to build teams the way that big spenders can and must get creative to exceed expectations.
In either case, the outliers are rare exceptions. During the past 10 years, 23 of the 30 teams have win/loss and spending ranks that fall within a +/- 10 rank window. During the past five years, 25 teams qualify.
While spending money wisely should be a factor in resultant success, the amount of spending should not be a determinant.
Unfortunately, that's currently the case. Without a salary cap or other structure to modify the current payroll disparity, a minority of teams will continue to spend more to give them a built-in advantage.
Friday, November 6, 2009
Sports: If Major League Baseball Mimicked the NBA
0
comments
Friday, November 06, 2009
Posted by
Jon Loomer
Labels: Economics, Major League Baseball, NBA, Payroll
|
During the past week or so, I've been bogged down in research. I know that Major League Baseball has problems. I know that the Yankees represent that problem. Still. I wanted to compare baseball to the other major sports leagues that I perceived to provide more parity.
Today, I want to focus on the NBA. The NBA has a soft cap, so the league is able to do a pretty decent job of managing payroll. The "soft" cap allows teams to exceed the cap under certain circumstances -- namely, keeping players, but there are several exceptions. Those who otherwise go over a certain level ("tax level") are taxed dollar for dollar.
Outside of there being a soft cap, there is a great deal of structure in the NBA. There are minimum and maximum salaries for players, depending on service time. There are minimum salaries in baseball, but that's really it. No other restrictions. That's how the MLBPA likes it.
Of course, it's never that simple. I encourage you to read Larry Coon's NBA Salary Cap FAQ. Very informative.
While it would be nice to apply such a structure to Major League Baseball, I'm not going to go there yet. Instead, I simply want to review the disparity between the highest and lowest spending teams in each league and then put baseball on a similar scale to see how the league would look.
Baby steps.
So here are the two leagues and their payrolls from top to bottom:
The differences between the two are striking at first glance, but let's put some objectivity behind it.
I'm comparing MLB to NBA for a couple of reasons. First, both leagues have the same number of teams, so it makes for a more uniform comparison. Second, I'm having a heck of a time finding dependable 2009 salary data for the NFL. If anyone has it, let me know.
But you can't deny the enormous differences here. Let's highlight the bomb shells:
Something that is easy to overlook is the disparity between average player salary and highest salary. In the NBA, there's not a big jump. Not the case in baseball.
Of course, you could argue that this has something to do with the number of players in baseball pulling the average salary down. But it also has a lot to do with the fact that there is no cap, allowing some teams (one in particular) to pay a seemingly unlimited amount for the best players.
There's no need to continuously repeat this, but Major League Baseball doesn't play with anything that is close to an even playing field. And as the NBA shows, you don't need everyone with the same payroll. Just give everyone the same tools and put a system in place where the disparity is negligible.
So what would Major League Baseball look like if the disparity between the teams was equal to that in the NBA? Here it is (in addition to current payroll and the difference):
Note that total payroll is nearly identical between actual 2009 and adjusted. Some teams would need to take on more payroll and some would have to take on less (and the Yankees would need to take on significantly less).
For those needing to take on more, it's possible they would do this naturally if you put a cap in play. What motivation do the Pirates have to dish out more salary? Very little.
For all of the teams taking on more, you suddenly have a chance. Every year is "your year." Go for it. Make some signings. Add payroll. It's a risk worth taking.
Right now, it's not a risk worth taking.
Obviously, the league doesn't need to look exactly like this, but it's how Major League Baseball would look if payroll distribution were identical to the NBA. This analysis does nothing to explain how baseball would actually get to this point -- or at least, not yet. We'll pursue it.
How does it look to you?
Today, I want to focus on the NBA. The NBA has a soft cap, so the league is able to do a pretty decent job of managing payroll. The "soft" cap allows teams to exceed the cap under certain circumstances -- namely, keeping players, but there are several exceptions. Those who otherwise go over a certain level ("tax level") are taxed dollar for dollar.
Outside of there being a soft cap, there is a great deal of structure in the NBA. There are minimum and maximum salaries for players, depending on service time. There are minimum salaries in baseball, but that's really it. No other restrictions. That's how the MLBPA likes it.
Of course, it's never that simple. I encourage you to read Larry Coon's NBA Salary Cap FAQ. Very informative.
While it would be nice to apply such a structure to Major League Baseball, I'm not going to go there yet. Instead, I simply want to review the disparity between the highest and lowest spending teams in each league and then put baseball on a similar scale to see how the league would look.
Baby steps.
So here are the two leagues and their payrolls from top to bottom:
| Team | Payroll | | Team | Payroll |
| 1. NY Yankees | $208,097,414 | 1. Los Angeles Lakers | $91,377,313 | |
| 2. NY Mets | $145,367,987 | 2. Utah Jazz | $84,654,219 | |
| 3. Chicago Cubs | $134,058,500 | 3. Boston Celtics | $84,220,991 | |
| 4. Boston | $122,435,399 | 4. New York Knicks | $82,504,966 | |
| 5. Detroit | $119,160,145 | 5. Orlando Magic | $80,532,126 | |
| 6. LA Angels | $118,964,000 | 6. Cleveland Cavaliers | $79,975,195 | |
| 7. Seattle | $112,053,666 | 7. San Antonio Spurs | $79,583,715 | |
| 8. Philadelphia | $111,209,046 | 8. Dallas Mavericks | $78,516,175 | |
| 9. Houston | $102,996,414 | 9. Washington Wizards | $77,908,291 | |
| 10. Chicago Sox | $100,598,500 | 10. Houston Rockets | $74,271,249 | |
| 11. LA Dodgers | $100,008,592 | 11. Miami Heat | $74,233,956 | |
| 12. Atlanta | $94,313,666 | 12. New Orleans Hornets | $73,656,549 | |
| 13. St. Louis | $87,703,409 | 13. Denver Nuggets | $70,325,150 | |
| 14. San Francisco | $82,616,450 | 14. Chicago Bulls | $69,967,615 | |
| 15. Kansas City | $81,384,553 | 15. Charlotte Bobcats | $66,975,036 | |
| 16. Milwaukee | $80,182,502 | 16. Milwaukee Bucks | $66,819,300 | |
| 17. Cincinnati | $73,558,500 | 17. Indiana Pacers | $63,830,172 | |
| 18. Arizona | $73,516,666 | 18. Golden State Warriors | $63,147,477 | |
| 19. Texas | $73,439,238 | 19. Phoenix Suns | $62,325,810 | |
| 20. Toronto | $72,563,200 | 20. Sacramento Kings | $62,165,268 | |
| 21. Colorado | $72,428,000 | 21. Philadelphia 76ers | $61,945,532 | |
| 22. Tampa Bay | $68,230,934 | 22. Atlanta Hawks | $58,911,721 | |
| 23. Minnesota | $67,634,766 | 23. Los Angeles Clippers | $58,871,653 | |
| 24. Cleveland | $66,757,366 | 24. Toronto Raptors | $57,269,516 | |
| 25. Washington | $62,001,000 | 25. New Jersey Nets | $56,776,067 | |
| 26. Baltimore | $61,885,566 | 26. Portland Trail Blazers | $56,713,022 | |
| 27. Oakland | $56,089,250 | 27. Memphis Grizzlies | $56,292,253 | |
| 28. San Diego | $37,800,800 | 28. Minnesota Timberwolves | $54,577,640 | |
| 29. Florida | $35,774,000 | 29. Detroit Pistons | $49,914,212 | |
| 30. Pittsburgh | $25,197,000 | 30. Oklahoma City Thunder | $49,887,530 |
The differences between the two are striking at first glance, but let's put some objectivity behind it.
| Comparison | MLB | NBA |
| Total Players | 910 | 407 |
| Total Payroll | $2,648,026,529 | $2,048,149,719 |
| Avg Salary | $2,909,919 | $5,032,308.89 |
| Avg Players/Tm | 30.3 | 13.6 |
| Avg Payroll | $88,267,551 | $68,271,657 |
| Highest Payroll | $208,097,414 | $91,377,313 |
| Lowest Payroll | $25,197,000 | $49,887,530 |
| Hi/Lo Payroll Disparity | $182,900,414 | $41,489,783 |
| Lo/Hi Payroll Disparity % | 12.1% | 54.6% |
| Med Payroll | $80,783,528 | $66,897,168 |
| Hi/Med Payroll Disp | $127,313,887 | $24,480,145 |
| Med/Hi Payroll Disp% | 38.8% | 73.2% |
| Hi/Avg Payroll Disp | $119,829,863 | $23,105,656 |
| Avg/Hi Payroll Disp% | 42.4% | 74.7% |
| Min Salary | $400,000 | $457,588 |
| Max Salary | $33,000,000 | $23,239,561 |
| Lo/Hi Player Disp % | 1.2% | 2.0% |
| Avg/Hi Player Disp % | 8.8% | 21.7% |
I'm comparing MLB to NBA for a couple of reasons. First, both leagues have the same number of teams, so it makes for a more uniform comparison. Second, I'm having a heck of a time finding dependable 2009 salary data for the NFL. If anyone has it, let me know.
But you can't deny the enormous differences here. Let's highlight the bomb shells:
- Lowest payroll is 54.6% of the highest payroll in the NBA; 12.1% in MLB
- Median payroll is 73.2% of the highest payroll in the NBA; 38.8% in MLB
- Average salary is 21.7% of the highest salary in the NBA; 8.8% in MLB
Something that is easy to overlook is the disparity between average player salary and highest salary. In the NBA, there's not a big jump. Not the case in baseball.
Of course, you could argue that this has something to do with the number of players in baseball pulling the average salary down. But it also has a lot to do with the fact that there is no cap, allowing some teams (one in particular) to pay a seemingly unlimited amount for the best players.
There's no need to continuously repeat this, but Major League Baseball doesn't play with anything that is close to an even playing field. And as the NBA shows, you don't need everyone with the same payroll. Just give everyone the same tools and put a system in place where the disparity is negligible.
So what would Major League Baseball look like if the disparity between the teams was equal to that in the NBA? Here it is (in addition to current payroll and the difference):
| Team | 2009 Payroll | Adjusted | Change |
| 1. NY Yankees | $208,097,414 | $118,142,483 | -$89,954,931 |
| 2. NY Mets | $145,367,987 | $109,450,140 | -$35,917,847 |
| 3. Chicago Cubs | $134,058,500 | $108,890,016 | -$25,168,484 |
| 4. Boston | $122,435,399 | $106,671,353 | -$15,764,046 |
| 5. Detroit | $119,160,145 | $104,120,652 | -$15,039,493 |
| 6. LA Angels | $118,964,000 | $103,400,591 | -$15,563,409 |
| 7. Seattle | $112,053,666 | $102,894,443 | -$9,159,223 |
| 8. Philadelphia | $111,209,046 | $101,514,212 | -$9,694,834 |
| 9. Houston | $102,996,414 | $100,728,274 | -$2,268,140 |
| 10. Chicago Sox | $100,598,500 | $96,025,912 | -$4,572,588 |
| 11. LA Dodgers | $100,008,592 | $95,977,695 | -$4,030,897 |
| 12. Atlanta | $94,313,666 | $95,231,161 | $917,495 |
| 13. St. Louis | $87,703,409 | $90,923,968 | $3,220,559 |
| 14. San Francisco | $82,616,450 | $90,461,708 | $7,845,258 |
| 15. Kansas City | $81,384,553 | $86,592,578 | $5,208,025 |
| 16. Milwaukee | $80,182,502 | $86,391,225 | $6,208,723 |
| 17. Cincinnati | $73,558,500 | $82,526,557 | $8,968,057 |
| 18. Arizona | $73,516,666 | $81,643,895 | $8,127,229 |
| 19. Texas | $73,439,238 | $80,581,555 | $7,142,317 |
| 20. Toronto | $72,563,200 | $80,373,989 | $7,810,789 |
| 21. Colorado | $72,428,000 | $80,089,890 | $7,661,890 |
| 22. Tampa Bay | $68,230,934 | $76,167,451 | $7,936,517 |
| 23. Minnesota | $67,634,766 | $76,115,647 | $8,480,881 |
| 24. Cleveland | $66,757,366 | $74,044,231 | $7,286,865 |
| 25. Washington | $62,001,000 | $73,406,246 | $11,405,246 |
| 26. Baltimore | $61,885,566 | $73,324,735 | $11,439,169 |
| 27. Oakland | $56,089,250 | $72,780,719 | $16,691,469 |
| 28. San Diego | $37,800,800 | $70,563,882 | $32,763,082 |
| 29. Florida | $35,774,000 | $64,534,497 | $28,760,497 |
| 30. Pittsburgh | $25,197,000 | $64,500,000 | $39,303,000 |
| TOTAL | $2,648,026,529 | $2,648,069,706 | $43,177 |
Note that total payroll is nearly identical between actual 2009 and adjusted. Some teams would need to take on more payroll and some would have to take on less (and the Yankees would need to take on significantly less).
For those needing to take on more, it's possible they would do this naturally if you put a cap in play. What motivation do the Pirates have to dish out more salary? Very little.
For all of the teams taking on more, you suddenly have a chance. Every year is "your year." Go for it. Make some signings. Add payroll. It's a risk worth taking.
Right now, it's not a risk worth taking.
Obviously, the league doesn't need to look exactly like this, but it's how Major League Baseball would look if payroll distribution were identical to the NBA. This analysis does nothing to explain how baseball would actually get to this point -- or at least, not yet. We'll pursue it.
How does it look to you?
Subscribe to:
Posts (Atom)