As I've been burying myself in research to rank the top 300 offensive baseball players ever, something continues to bug me and I hadn't been able to figure out why until now.
We have this incredibly difficult time evaluating careers. We always have to ask the following two questions:
1) Was he one of the greats of his era?
2) Did he compile comparatively great career totals?
The second one is what bugs me. You can have two players who were the greatest of their respective eras. Put up identical stats for 12 years. One player retired and never played again. The other played, though horribly, for another eight years. We will say that the player with 20 years of service time is a Hall of Famer, while the one with 12 is not.
Yet, in the end, aren't those 12 years what actually make each player a Hall of Famer in the first place?
But it wasn't until I started comparing players to the league average that I realized just how insane this is. Player after player with dominant stats, but short careers. Not in the Hall of Famer. Player after player with unimpressive stats on an annual basis, but a long career. Hall of Famer.
Let's say you start your career at age 20 in 1985. You are a productive -- though statistically average -- and durable player. You are able to last 25 years. Guess what? You'd end up with the following totals:
.263 AVG
3,074 Hits
336 Home Runs
231 Stolen Bases
Now, this may be an extreme example. Very few players will last 25 years, particularly if they only produce the league average from start to finish. But do you see where this is going?
It really hit me when I looked at Pete Rose's numbers. He had a career batting average of .303 and a career record 4,256 hits. The league average over the course of his career was .254. Had Pete rose hit .254 instead of .303, he would have finished with 3,592 career hits -- or fourth behind Cobb, Aaron and Musial.
While I understand that he was able to compile that number of plate appearances because he hit a career .303, it still goes to show you how silly the necessity is for career benchmarks. You only need to be slightly better than the league average every season, be durable, play for 20 years, and you should compile Hall of Fame stats. Now this is easier said than done, obviously, but the fact that it's possible tells me we are focusing on the wrong stats.
The Hall of Fame is for all-time greats. It's not for "consistently average to above average and durable for a long time." If you were one of the most dominant players for a decade, it should not matter what else you did.
That's why I'm completely altering how I analyze players in my Top 300. Originally, I'd look both at career stats versus the league average as well as annual stats versus the league average. I now realize there is no need for this.
I am taking ratios of player performance over league average and comparing it to all players in the history of the game for a given category. If you have a season in the top 10, you are one of the all-time greats in a statistic (even if for a season). If you are in the top 20, a handful of times, you clearly had a few excellent seasons. If you repeatedly show up in the top 100 in this and other categories, you are a great baseball player.
Does it really matter if this person ended up with 3,000 hits or 600 home runs? Does it matter if he padded his stats with 10 years past his prime?
This doesn't mean that I will anoint players who were dominant for two seasons as Hall of Famers. It means that number of dominant years -- and in the most statistics -- will be my measuring stick, not career numbers. In many, but not all, cases the career stats will follow.
Through my analysis, I've stumbled upon several players who dropped off the face of the earth after about 10 great years. I have never even heard of some of them. They put up some amazing seasons, but they don't have great career totals.
Should that really mean they aren't Hall of Famers?
Thursday, February 25, 2010
Wednesday, February 24, 2010
Sports: The Lineup Debate
|
As a baseball fan, it's fun to play manager. We always think we're a little smarter, or we at least could improve upon a certain aspect of our favorite team's management. Bunting, stealing a base, use of the bullpen, use of platoons. We argue about it all. But one of the most basic management strategies is also the most hotly contested.
The Lineup Card.
Everyone has an opinion. The manager is almost always wrong.
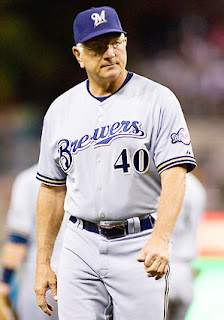
The season hasn't even started, and we're already debating lineups. Milwaukee Brewers manager Ken Macha admitted to toying with the idea of batting the pitcher eighth this year, moving speedy rookie Alcides Escobar to the nine hole.
He's crazy! Why would you give the pitcher more at bats than a non-pitcher?! Managers never do this, and there's a reason for that!
Well, this actually isn't the first time a manager has considered such a strategy. St. Louis Cardinals manager Tony LaRussa often uses it (he abandoned it last season). LaRussa, though, wasn't the first.
And it's not the first time Brewer fans have dealt with this issue either. Former manager Ned Yost also employed it from time to time. I admit, I thought it was idiotic when Yost did it. But I generally doubted Yost's baseball acumen in general, so it just seemed to me like he was trying to look smart without having any supporting evidence to do it.
When Macha discussed it, I may have had a slightly different reaction. The first was, "Eh?" But I at least heard him out.
When Yost did it, he batted Jason Kendall ninth as his "second lead-off hitter." With Macha, it's Escobar. Immediately, the argument seems to be much stronger this time around.
Baseball has traditions, and the lineup is one of them. We've come to expect the following in a National League lineup:
 1) Fastest player
2) Slap hitter who controls the bat well, bunts, probably doesn't hit for much power
3) Team's best hitter
4) Team's most dangerous power hitter
5) Next most dangerous power hitter, provides protection for clean-up hitter
6) Next best power hitter
7) Next best hitter
8) Team's worst non-pitching hitter
9) Pitcher
This is the way it is, and the way it's seemingly always been. There are defined roles in the lineup, and some rather poor players have made a career out of satisfying one of these roles.
Yet, the dirty little secret in baseball is that the lineup means less than any of us wants to admit. Studies by Cyril Morong of BeyondTheBoxscore, Ken Arneson of CatFishStew and Ryan Armbrust of ThePastime have all provided some support for questioning the generally accepted lineup strategies. It's largely over my head, in some cases, so I encourage you to read it for yourself so I don't do it a disservice by attempting to explain the work.
BaseballMusings gets credit for bringing it all together and creating a nifty little lineup tool. Based on On Base Percentage and Slugging Percentage, the tool generates the lineups that will result in the most and least possible runs scored.
Here is an example, based on the Milwaukee Brewers' 2010 projected roster.
As you can see, they speculate that the Brewers would score the most possible runs with Prince Fielder hitting lead-off and Ryan Braun hitting second. Additionally, Yovani Gallardo (or whatever pitcher would throw on that day) would hit eighth with Alcides Escobar hitting ninth. Not surprisingly, the line-up that would result in the least runs has the pitcher batting first.
Now, forget for a moment that it looks funny having big Prince Fielder bat lead-off. Throw out the traditions of baseball for a moment. Have an open mind.
It makes sense.
It makes sense because you want your best hitters to get as many at bats as possible throughout the game. That would give you, one would expect, the best possible chance to win.
It makes sense that Escobar would hit ninth instead of eighth since it would make it more likely that a runner would be on when Fielder and Braun come to the plate after the first inning.
But your biggest power hitters need to hit third and fourth because they need to come up with runners on base. You are giving up runs by having them hit at the top of the order!
This may be true, but in the first inning only. Over the course of the season, however, if you are giving your two best hitters more plate appearances, shouldn't that result in more home runs? More runs?
It's also interesting that Carlos Gomez, who some may see as a prototypical lead-off or number two hitter due to his blazing speed, is often listed second in the lineup as part of the "Worst Lineups" list. Gomez is often sixth or seventh in the "Best Lineups" list, which would be atypical. You'd never see a no-power hitter like Gomez hit sixth.
But in these cases, it appears the intent is to hide your worst hitters (Gomez and Hart) in the six and seven holes before the pitcher.
Whether you think this is a crazy lineup or not, possibly the most interesting part of this study is the difference between the highest (5.295 runs) and lowest (4.613) scoring lineups. In other words, the worst thing you could possibly do with your lineup is cost your team about .7 runs per game. And that's by hitting the pitcher lead-off.
Now, this is based entirely on statistics, and I'd argue that it misses some important factors. For example, speed is never a consideration. It's based entirely on OBP and SLG. However, if you have two players with similar OBP, wouldn't you rather have the one with better speed on base in front of a good hitter? He would have a better chance to score from first on a double or from second on a single.
That said, I still appreciate the study. It makes us question conventional wisdom. That's always a good thing. And it provides some statistical evidence that batting the pitcher eighth isn't all that crazy.
And more than anything, it makes me question these set roles we've come to expect. Particularly when you have players like Ryan Braun and Prince Fielder, who hit home runs and extra base hits at a high rate, speed in front of them is of little use. Base runners will not (or should not) regularly attempt stolen bases with Braun and Fielder up or coming to the plate.
In the end, what should a Brewer fan want more than anything else when Braun or Fielder are up? It really should be an easy answer. You want base runners. And whether that means batting them early in the lineup and a non-pitcher ninth or it means simply loading the top of the lineup with high OBP hitters, you accomplish that.
Instead, I've seen many asking for Escobar to lead off and Corey Hart to bat second. Why? Because Escobar is the fastest and Hart also has speed. Would this really accomplish more runs than putting two players at the top of the order who reach base most often?
Maybe Prince Fielder shouldn't hit lead-off. Maybe he should. But baseball, though it is great partly because of its history and traditions, also fails to progress because of them. It isn't blasphemous to question the way things have always been done. Innovation isn't a dirty word.
In all likelihood, we won't notice any difference no matter what lineup Macha writes up. But he's bound to be criticized the first time the pitcher, batting eighth, comes up to bat in a crucial situation with two outs. And it's unlikely he'll get any credit when, over the course of the season, the Brewers score a couple of runs more.
In the end, that's all it's going to be. Teams aren't going to hit the pitcher first, second, third, or anything other than eighth or ninth. So in the end, the difference in lineups for a single game is close to nothing, completely unnoticeable. So while we shouldn't expect Fielder to bat lead-off, it isn't going to make much of a difference where he hits.
But I guess if it were obvious who needed to bat where, we'd have nothing to argue about. And that, after all, is part of the fun of being a baseball fan.
The Lineup Card.
Everyone has an opinion. The manager is almost always wrong.
The season hasn't even started, and we're already debating lineups. Milwaukee Brewers manager Ken Macha admitted to toying with the idea of batting the pitcher eighth this year, moving speedy rookie Alcides Escobar to the nine hole.
He's crazy! Why would you give the pitcher more at bats than a non-pitcher?! Managers never do this, and there's a reason for that!
Well, this actually isn't the first time a manager has considered such a strategy. St. Louis Cardinals manager Tony LaRussa often uses it (he abandoned it last season). LaRussa, though, wasn't the first.
And it's not the first time Brewer fans have dealt with this issue either. Former manager Ned Yost also employed it from time to time. I admit, I thought it was idiotic when Yost did it. But I generally doubted Yost's baseball acumen in general, so it just seemed to me like he was trying to look smart without having any supporting evidence to do it.
When Macha discussed it, I may have had a slightly different reaction. The first was, "Eh?" But I at least heard him out.
When Yost did it, he batted Jason Kendall ninth as his "second lead-off hitter." With Macha, it's Escobar. Immediately, the argument seems to be much stronger this time around.
Baseball has traditions, and the lineup is one of them. We've come to expect the following in a National League lineup:

2) Slap hitter who controls the bat well, bunts, probably doesn't hit for much power
3) Team's best hitter
4) Team's most dangerous power hitter
5) Next most dangerous power hitter, provides protection for clean-up hitter
6) Next best power hitter
7) Next best hitter
8) Team's worst non-pitching hitter
9) Pitcher
This is the way it is, and the way it's seemingly always been. There are defined roles in the lineup, and some rather poor players have made a career out of satisfying one of these roles.
Yet, the dirty little secret in baseball is that the lineup means less than any of us wants to admit. Studies by Cyril Morong of BeyondTheBoxscore, Ken Arneson of CatFishStew and Ryan Armbrust of ThePastime have all provided some support for questioning the generally accepted lineup strategies. It's largely over my head, in some cases, so I encourage you to read it for yourself so I don't do it a disservice by attempting to explain the work.
BaseballMusings gets credit for bringing it all together and creating a nifty little lineup tool. Based on On Base Percentage and Slugging Percentage, the tool generates the lineups that will result in the most and least possible runs scored.
Here is an example, based on the Milwaukee Brewers' 2010 projected roster.
As you can see, they speculate that the Brewers would score the most possible runs with Prince Fielder hitting lead-off and Ryan Braun hitting second. Additionally, Yovani Gallardo (or whatever pitcher would throw on that day) would hit eighth with Alcides Escobar hitting ninth. Not surprisingly, the line-up that would result in the least runs has the pitcher batting first.
Now, forget for a moment that it looks funny having big Prince Fielder bat lead-off. Throw out the traditions of baseball for a moment. Have an open mind.
It makes sense.
It makes sense because you want your best hitters to get as many at bats as possible throughout the game. That would give you, one would expect, the best possible chance to win.
It makes sense that Escobar would hit ninth instead of eighth since it would make it more likely that a runner would be on when Fielder and Braun come to the plate after the first inning.
But your biggest power hitters need to hit third and fourth because they need to come up with runners on base. You are giving up runs by having them hit at the top of the order!
This may be true, but in the first inning only. Over the course of the season, however, if you are giving your two best hitters more plate appearances, shouldn't that result in more home runs? More runs?
It's also interesting that Carlos Gomez, who some may see as a prototypical lead-off or number two hitter due to his blazing speed, is often listed second in the lineup as part of the "Worst Lineups" list. Gomez is often sixth or seventh in the "Best Lineups" list, which would be atypical. You'd never see a no-power hitter like Gomez hit sixth.
But in these cases, it appears the intent is to hide your worst hitters (Gomez and Hart) in the six and seven holes before the pitcher.
Whether you think this is a crazy lineup or not, possibly the most interesting part of this study is the difference between the highest (5.295 runs) and lowest (4.613) scoring lineups. In other words, the worst thing you could possibly do with your lineup is cost your team about .7 runs per game. And that's by hitting the pitcher lead-off.
Now, this is based entirely on statistics, and I'd argue that it misses some important factors. For example, speed is never a consideration. It's based entirely on OBP and SLG. However, if you have two players with similar OBP, wouldn't you rather have the one with better speed on base in front of a good hitter? He would have a better chance to score from first on a double or from second on a single.
That said, I still appreciate the study. It makes us question conventional wisdom. That's always a good thing. And it provides some statistical evidence that batting the pitcher eighth isn't all that crazy.
And more than anything, it makes me question these set roles we've come to expect. Particularly when you have players like Ryan Braun and Prince Fielder, who hit home runs and extra base hits at a high rate, speed in front of them is of little use. Base runners will not (or should not) regularly attempt stolen bases with Braun and Fielder up or coming to the plate.
In the end, what should a Brewer fan want more than anything else when Braun or Fielder are up? It really should be an easy answer. You want base runners. And whether that means batting them early in the lineup and a non-pitcher ninth or it means simply loading the top of the lineup with high OBP hitters, you accomplish that.
Instead, I've seen many asking for Escobar to lead off and Corey Hart to bat second. Why? Because Escobar is the fastest and Hart also has speed. Would this really accomplish more runs than putting two players at the top of the order who reach base most often?
Maybe Prince Fielder shouldn't hit lead-off. Maybe he should. But baseball, though it is great partly because of its history and traditions, also fails to progress because of them. It isn't blasphemous to question the way things have always been done. Innovation isn't a dirty word.
In all likelihood, we won't notice any difference no matter what lineup Macha writes up. But he's bound to be criticized the first time the pitcher, batting eighth, comes up to bat in a crucial situation with two outs. And it's unlikely he'll get any credit when, over the course of the season, the Brewers score a couple of runs more.
In the end, that's all it's going to be. Teams aren't going to hit the pitcher first, second, third, or anything other than eighth or ninth. So in the end, the difference in lineups for a single game is close to nothing, completely unnoticeable. So while we shouldn't expect Fielder to bat lead-off, it isn't going to make much of a difference where he hits.
But I guess if it were obvious who needed to bat where, we'd have nothing to argue about. And that, after all, is part of the fun of being a baseball fan.
Monday, February 22, 2010
Sports: Spreadsheet Madness
|
My nights and weekends have been filled with pounding away at Excel. Magic is happening. Determined to provide some clarity to who the greatest 300 offensive baseball players were of all time, why, and in what order.
Why stop at 300? Good question. I'm collecting the data of close to 1,000, so there's really no reason to stop there. Could easily expand this to 500, but I may be getting ahead of myself. An awful lot of thought and analysis has to go into each selection.
Originally, I was going to divulge the number one offensive player first. Then I collected the data of 32 greats in an effort to find the best of the bunch. Suddenly, I realized that I couldn't stop with 32 to determine the best. I needed a much bigger sample size.
That doesn't mean that I don't have enough data to determine the greatest. I know who it is. However, I've been as meticulous as I've ever been through this process to make sure that every step is as accurate as possible. Just wrong to get sloppy with the crowning of the best ever.
For example, I could have set a baseline for the average player to compare all players to. Could have been rather similar from year to year. Could have been based on theory. Could have cut corners.
Didn't happen. The average player is variable from year to year. It is variable based on number of teams, number of teams with the DH, number of games played, and average statistics. Significant calculation goes into even that baseline determination.
And we could have used the same number of plate appearances each season for that average player, or we could have based it on the total number of games played that season. But I didn't. I realize that several factors go into the typical number of plate appearances. Different years will call for different strategies when it comes to pinch hitting, use of the farm system, impact of injuries, on and on. So I lined up the X (where X equals the total number of starting positions in a season) most plate appearances and averaged them.
Luckily, I even made that calculation for all 135 seasons. While somewhat consistent, there was variation. The minimum average plate appearances per game was 3.14 while the maximum was 4.19. That variation of more than one per game can result in more than 100 plate appearances for the season -- which can significantly throw off our comparison point.
I also realized that I don't want to make this study anti-climactic. If I reveal number one right away, suddenly you will lose interest. Hey, even I may lose interest. So I am going to start from the back and work my way to the front -- at least for the purpose of revealing the results.
But to be honest, I don't yet know the results. I am still loading career stats into my handy spreadsheet. That spreadsheet is becoming so large that it is turning into three and four working spreadsheets. I just pasted in Tito Francona. Yeah, I'm going deep.
I paste in Tito's stats, and the work is done for me. It's good stuff. But there's still a lot of pasting to do.
So I think I'd be doing this project a disservice by starting from the beginning, particularly before even completing the research. I am going to start from the bottom, and the results will hopefully reinforce my rankings for the top.
It may be a week or two until the first results begin trickling in, but they're coming. And I may be close to invisible on Twitter (and to my wife) in the meantime.
Until then... the 2010 baseball season is coming!
Sunday, February 21, 2010
Sports: The Importance of the Average Player
|
As you know, I've been working on a project to rank the 300 greatest offensive baseball players of all time. I am starting with number one.
I've been putting Baseball-Reference and Excel to work during the past week. Past several weeks, really. I am luckily a little more than dangerous with spreadsheets, so I can make some very quick magic of data and a plan.
Here is what I'm doing to make my final rankings:
1) Collect the stats of the 1,000 retired players who accumulated the most hits during their careers (this is a safe number from which I can expect to find my top 300 players);
2) Compare the raw career data of all players, between eras;
3) Compare ratios of career stats over average player had the hypothetical player had the same number of plate appearances;
4) Compare ratios of individual season by taking the star player's stats over the hypothetical average player (based on the average player's number of plate appearances, not the star player's).
 As we know, the raw data in #2 has minimal value. It has some. It's interesting to know. But it is data that has no perspective. It's simply dangerous to compare the home runs hit by Honus Wagner, for example, to those hit by Cal Ripken.
So it is important to compare player stats to a baseline, which I like to call the average player. It is a theoretical player that doesn't exist. But the data is variable from year to year to reflect the environment of the star player's production.
In the end, the average player is critical to the success of this project. It is important to me to find the truth in data in order to make assumptions about players. The only way you can find truth is by taking statistics in perspective.
Therefore, how much greater were Babe Ruth's 60 home runs than that of the average player in 1927? And how does such a performance stack up in the history of baseball?
Also, if you were to take the ratios of Ruth's home runs to the league average for each season of his career, how many of his seasons would be among the all-time greats (he actually has the four highest ratios ever)?
Focusing on the right statistics is an important chore. Avoid duplication that may favor a particular type of player. Don't focus on numbers of little significance, like sacrifice flies. And, whenever possible, focus on stats that apply to all eras (only a handful of stats were kept dating back to 1876).
Let me show you a quick example of some of the work I've been doing. Following are the career stats of Pete Rose when compared to the the average player over the same number of plate appearances, along with the resultant ratios:
So in this case, both Pete Rose and the average player had 15,861 plate appearances to accumulate their stats. The average player's rate of success was different from year to year. Note that I find other stats as well, but I am limited for space here.
As you can tell from the numbers above, Pete Rose performed above the league average in runs, hits, walks, total bases, batting average, on-base percentage, slugging percentage and OPS; he was below average in home runs, runs batted in and (surprisingly) stolen bases.
So, Rose has certain ratios for each career offensive statistic. You will remember that I am comparing him to 31 other greats to find the greatest player of all time (to begin this project). You may be interested in knowing Rose's ranks when compared to those other 31 players in these statistics:
R (23)
H (14)
HR (31)
RBI (30)
SB (25)
BB (23)
BA (20)
OBP (26)
SLG (32)
OPS (31)
TB (31)
Think it's strange that the game's all-time hits king is 14th when compared to the other 31 players in ratio over the average player? Not when you break it down. Rose accumulated that many hits, not because he was the greatest hitter of all time, but because he was a very good hitter who played a long, long time. Finishing with a batting average 19% above the league average is good, but even the average hitter will accumulate nearly 3,600 hits with close to 16,000 plate appearances (see the table above).
Of course, Rose's long career hinders him in a sense. He played well beyond his prime, so his skills diminished and ratios dropped as a result. But there is yet another way we can look at his career.
Let's go year by year and compare how Rose did versus the league average.
[Note the prior discussion of not duplicating statistics. While we list all statistics together here, they are taken in context. For example, averages (AVG, OBP, SLG, OPS) are observed together, with the understanding that OPS makes up OBP and SLG. Additionally, it is understood that HR, in particular, weights TB.]
This way, Rose is not penalized by having some bad years. We can say, for example, that he had 10 or 15 of the greatest seasons ever by isolating them in this way.
So, how does Rose's ratios from his 24 years compare to those of the other 31 greats? Not so great. He didn't have a single ratio (when compared to the other greats in that category) that was considered the best or one of the top five best. He had three in the top 20 and five ratios in the top 50. That's not many when you consider we're comparing more than a dozen statistics for all 24 of his seasons (more than 250 chances).
By comparison, Babe Ruth has 78 ratios in the one of the categorical top 50s. While Ruth may be an unfair comparison for anyone, his career was much shorter as well.
We're able to see the truth about Rose's career with some very nifty use of data. The average player makes it all come to life.
I've been putting Baseball-Reference and Excel to work during the past week. Past several weeks, really. I am luckily a little more than dangerous with spreadsheets, so I can make some very quick magic of data and a plan.
Here is what I'm doing to make my final rankings:
1) Collect the stats of the 1,000 retired players who accumulated the most hits during their careers (this is a safe number from which I can expect to find my top 300 players);
2) Compare the raw career data of all players, between eras;
3) Compare ratios of career stats over average player had the hypothetical player had the same number of plate appearances;
4) Compare ratios of individual season by taking the star player's stats over the hypothetical average player (based on the average player's number of plate appearances, not the star player's).

So it is important to compare player stats to a baseline, which I like to call the average player. It is a theoretical player that doesn't exist. But the data is variable from year to year to reflect the environment of the star player's production.
In the end, the average player is critical to the success of this project. It is important to me to find the truth in data in order to make assumptions about players. The only way you can find truth is by taking statistics in perspective.
Therefore, how much greater were Babe Ruth's 60 home runs than that of the average player in 1927? And how does such a performance stack up in the history of baseball?
Also, if you were to take the ratios of Ruth's home runs to the league average for each season of his career, how many of his seasons would be among the all-time greats (he actually has the four highest ratios ever)?
Focusing on the right statistics is an important chore. Avoid duplication that may favor a particular type of player. Don't focus on numbers of little significance, like sacrifice flies. And, whenever possible, focus on stats that apply to all eras (only a handful of stats were kept dating back to 1876).
Let me show you a quick example of some of the work I've been doing. Following are the career stats of Pete Rose when compared to the the average player over the same number of plate appearances, along with the resultant ratios:
| Player | R | H | HR | RBI | SB | BB | TB | BA | OBP | SLG | OPS |
| Pete Rose | 2,165 | 4,256 | 160 | 1,314 | 198 | 1,566 | 5,752 | .303 | .375 | .409 | .784 |
| Avg Player | 1,709 | 3,592 | 318 | 1,594 | 248 | 1,333 | 5,316 | .254 | .319 | .376 | .695 |
| Ratio | 1.27 | 1.18 | 0.50 | 0.82 | 0.80 | 1.17 | 1.08 | 1.19 | 1.17 | 1.09 | 1.13 |
So in this case, both Pete Rose and the average player had 15,861 plate appearances to accumulate their stats. The average player's rate of success was different from year to year. Note that I find other stats as well, but I am limited for space here.
As you can tell from the numbers above, Pete Rose performed above the league average in runs, hits, walks, total bases, batting average, on-base percentage, slugging percentage and OPS; he was below average in home runs, runs batted in and (surprisingly) stolen bases.
So, Rose has certain ratios for each career offensive statistic. You will remember that I am comparing him to 31 other greats to find the greatest player of all time (to begin this project). You may be interested in knowing Rose's ranks when compared to those other 31 players in these statistics:
R (23)
H (14)
HR (31)
RBI (30)
SB (25)
BB (23)
BA (20)
OBP (26)
SLG (32)
OPS (31)
TB (31)
Think it's strange that the game's all-time hits king is 14th when compared to the other 31 players in ratio over the average player? Not when you break it down. Rose accumulated that many hits, not because he was the greatest hitter of all time, but because he was a very good hitter who played a long, long time. Finishing with a batting average 19% above the league average is good, but even the average hitter will accumulate nearly 3,600 hits with close to 16,000 plate appearances (see the table above).
Of course, Rose's long career hinders him in a sense. He played well beyond his prime, so his skills diminished and ratios dropped as a result. But there is yet another way we can look at his career.
Let's go year by year and compare how Rose did versus the league average.
| Year | R | H | HR | RBI | SB | BB | TB | BA | OBP | SLG | OPS |
| 1963 | 1.8 | 1.4 | 0.5 | 0.8 | 2.4 | 1.3 | 1.3 | 1.1 | 1.1 | 1.0 | 1.0 |
| 1964 | 1.1 | 1.2 | 0.3 | 0.6 | 0.8 | 0.9 | 0.9 | 1.1 | 1.0 | 0.9 | 0.9 |
| 1965 | 2.1 | 1.8 | 0.9 | 1.5 | 1.3 | 1.6 | 1.7 | 1.3 | 1.2 | 1.2 | 1.2 |
| 1966 | 1.7 | 1.7 | 1.3 | 1.3 | 0.6 | 0.9 | 1.7 | 1.3 | 1.1 | 1.2 | 1.2 |
| 1967 | 1.6 | 1.5 | 1.2 | 1.6 | 1.9 | 1.3 | 1.5 | 1.2 | 1.2 | 1.2 | 1.2 |
| 1968 | 2.0 | 1.9 | 1.2 | 1.1 | 0.5 | 1.4 | 1.8 | 1.4 | 1.3 | 1.4 | 1.3 |
| 1969 | 2.0 | 1.8 | 1.4 | 1.5 | 1.0 | 1.7 | 1.8 | 1.4 | 1.3 | 1.4 | 1.4 |
| 1970 | 2.0 | 1.7 | 1.2 | 0.9 | 1.7 | 1.5 | 1.7 | 1.2 | 1.2 | 1.2 | 1.2 |
| 1971 | 1.6 | 1.7 | 1.3 | 0.9 | 2.1 | 1.5 | 1.6 | 1.2 | 1.2 | 1.2 | 1.2 |
| 1972 | 2.2 | 1.8 | 0.7 | 1.2 | 1.5 | 1.7 | 1.7 | 1.3 | 1.2 | 1.2 | 1.2 |
| 1973 | 2.0 | 1.9 | 0.5 | 1.2 | 1.4 | 1.4 | 1.7 | 1.3 | 1.2 | 1.2 | 1.2 |
| 1974 | 1.9 | 1.5 | 0.3 | 1.0 | 0.2 | 2.3 | 1.4 | 1.1 | 1.2 | 1.1 | 1.1 |
| 1975 | 1.9 | 1.7 | 0.7 | 1.4 | 0.0 | 1.9 | 1.6 | 1.2 | 1.2 | 1.2 | 1.2 |
| 1976 | 2.4 | 1.8 | 1.3 | 1.2 | 0.8 | 1.9 | 1.8 | 1.3 | 1.3 | 1.2 | 1.3 |
| 1977 | 1.5 | 1.6 | 0.7 | 1.1 | 1.6 | 1.4 | 1.5 | 1.2 | 1.1 | 1.1 | 1.1 |
| 1978 | 1.8 | 1.6 | 0.7 | 1.0 | 1.3 | 1.4 | 1.5 | 1.2 | 1.1 | 1.1 | 1.1 |
| 1979 | 1.4 | 1.6 | 0.3 | 1.0 | 2.0 | 2.1 | 1.4 | 1.2 | 1.3 | 1.1 | 1.2 |
| 1980 | 1.6 | 1.5 | 0.1 | 1.2 | 1.1 | 1.5 | 1.3 | 1.1 | 1.1 | 0.9 | 1.0 |
| 1981 | 1.9 | 1.7 | 0.0 | 0.9 | 0.6 | 1.5 | 1.4 | 1.3 | 1.2 | 1.1 | 1.1 |
| 1982 | 1.3 | 1.4 | 0.3 | 0.9 | 0.8 | 1.5 | 1.1 | 1.0 | 1.1 | 0.9 | 1.0 |
| 1983 | 0.9 | 1.0 | 0.0 | 0.8 | 0.6 | 1.2 | 0.8 | 0.9 | 1.0 | 0.7 | 0.8 |
| 1984 | 0.7 | 0.9 | 0.0 | 0.6 | 0.1 | 0.9 | 0.7 | 1.1 | 1.1 | 0.9 | 1.0 |
| 1985 | 1.0 | 0.9 | 0.2 | 0.8 | 0.8 | 1.9 | 0.7 | 1.0 | 1.2 | 0.8 | 1.0 |
| 1986 | 0.2 | 0.4 | 0.0 | 0.4 | 0.3 | 0.6 | 0.3 | 0.8 | 1.0 | 0.7 | 0.8 |
[Note the prior discussion of not duplicating statistics. While we list all statistics together here, they are taken in context. For example, averages (AVG, OBP, SLG, OPS) are observed together, with the understanding that OPS makes up OBP and SLG. Additionally, it is understood that HR, in particular, weights TB.]
This way, Rose is not penalized by having some bad years. We can say, for example, that he had 10 or 15 of the greatest seasons ever by isolating them in this way.
So, how does Rose's ratios from his 24 years compare to those of the other 31 greats? Not so great. He didn't have a single ratio (when compared to the other greats in that category) that was considered the best or one of the top five best. He had three in the top 20 and five ratios in the top 50. That's not many when you consider we're comparing more than a dozen statistics for all 24 of his seasons (more than 250 chances).
By comparison, Babe Ruth has 78 ratios in the one of the categorical top 50s. While Ruth may be an unfair comparison for anyone, his career was much shorter as well.
We're able to see the truth about Rose's career with some very nifty use of data. The average player makes it all come to life.
Sports: The Average Baseball Player by Year
|
Below is a table marking the stats of the "average player" for each Major League Baseball season since 1876. The statistics were determined as follows:
1) Use league AVG, OBP, SLG and OBP;
2) Find average rate of other cumulative stats by dividing total stat by total plate appearances;
3) Find the average player's plate appearances (details below);
4) Find average player's stats by applying rate as determined in #2 to plate appearances in #3.
The average player's plate appearances are found by:
1) Multiply number of offensive players in a starting lineup by number of teams to get total starting offensive positions (for example, (8 X 16) + (9 X 14) for 2009 (this is the total number of starting offensive positions that season -- we'll call it S);
2) Since S refers to the total number of starting offensive positions, we'll want to find the average plate appearances for the top S players.
Back to the example in 2009, there were a total of 254 starting positions. We would then list the top 254 players in plate appearances for that season and find the average of that number.
Once we apply the league average rate for cumulative stats to this number, we will get a much more realistic number for what to expect from the average player during that season.
| Year | PA | R | H | HR | RBI | SB | SO | BA | OBP | SLG | OPS |
| 2009 | 538.4 | 64.5 | 125.3 | 14.5 | 61.5 | 8.5 | 96.7 | .262 | .333 | .418 | .751 |
| 2008 | 532.0 | 64.0 | 124.7 | 13.8 | 61.1 | 7.9 | 93.3 | .264 | .333 | .416 | .749 |
| 2007 | 544.3 | 67.3 | 129.8 | 14.3 | 64.2 | 8.4 | 92.9 | .268 | .336 | .423 | .758 |
| 2006 | 548.1 | 68.8 | 131.4 | 15.7 | 65.6 | 8.1 | 92.3 | .269 | .337 | .432 | .768 |
| 2005 | 537.0 | 64.4 | 126.8 | 14.5 | 61.3 | 7.4 | 88.3 | .264 | .330 | .419 | .749 |
| 2004 | 543.6 | 67.4 | 128.4 | 15.7 | 64.2 | 7.5 | 91.8 | .266 | .335 | .428 | .763 |
| 2003 | 539.5 | 66.1 | 126.8 | 15.0 | 63.0 | 7.4 | 88.7 | .264 | .333 | .422 | .755 |
| 2002 | 538.3 | 64.6 | 124.8 | 14.6 | 61.5 | 7.9 | 90.6 | .261 | .331 | .417 | .748 |
| 2001 | 538.7 | 66.8 | 126.4 | 15.7 | 63.6 | 8.9 | 93.4 | .264 | .332 | .427 | .759 |
| 2000 | 543.9 | 71.4 | 129.4 | 16.3 | 67.9 | 8.4 | 89.7 | .270 | .345 | .437 | .782 |
| 1999 | 538.9 | 70.2 | 128.8 | 15.7 | 66.7 | 9.7 | 88.4 | .271 | .345 | .434 | .778 |
| 1998 | 538.5 | 66.6 | 127.3 | 14.5 | 63.2 | 9.4 | 91.2 | .266 | .335 | .420 | .755 |
| 1997 | 534.2 | 65.8 | 126.2 | 14.1 | 62.3 | 10.1 | 91.1 | .267 | .337 | .419 | .756 |
| 1996 | 539.2 | 69.5 | 128.8 | 15.1 | 65.6 | 9.9 | 89.2 | .270 | .340 | .427 | .767 |
| 1995 | 474.9 | 59.3 | 112.1 | 12.4 | 55.9 | 8.9 | 77.1 | .267 | .338 | .417 | .755 |
| 1994 | 391.7 | 49.6 | 93.6 | 10.4 | 46.8 | 7.1 | 62.2 | .270 | .339 | .424 | .763 |
| 1993 | 532.1 | 63.6 | 125.3 | 12.3 | 59.7 | 9.9 | 80.2 | .265 | .332 | .403 | .736 |
| 1992 | 518.0 | 56.0 | 117.9 | 9.8 | 52.5 | 10.5 | 76.0 | .256 | .322 | .377 | .700 |
| 1991 | 517.5 | 58.4 | 117.7 | 10.9 | 54.9 | 10.0 | 78.5 | .256 | .323 | .385 | .708 |
| 1990 | 522.1 | 58.4 | 119.9 | 10.8 | 54.7 | 10.7 | 77.7 | .258 | .325 | .385 | .710 |
| 1989 | 519.0 | 56.4 | 117.7 | 10.0 | 52.6 | 10.1 | 76.7 | .254 | .320 | .375 | .695 |
| 1988 | 523.5 | 57.1 | 119.1 | 10.4 | 53.3 | 10.8 | 76.7 | .254 | .318 | .378 | .696 |
| 1987 | 530.5 | 65.2 | 124.2 | 14.6 | 61.3 | 11.7 | 82.3 | .263 | .331 | .415 | .747 |
| 1986 | 522.9 | 60.3 | 119.9 | 12.4 | 56.6 | 10.8 | 80.3 | .258 | .326 | .395 | .721 |
| 1985 | 531.9 | 60.4 | 122.0 | 12.0 | 56.8 | 10.3 | 74.5 | .257 | .323 | .391 | .714 |
| 1984 | 523.6 | 58.4 | 121.9 | 10.6 | 54.7 | 9.9 | 73.4 | .260 | .323 | .385 | .708 |
| 1983 | 527.2 | 59.6 | 122.9 | 10.8 | 56.0 | 10.9 | 71.3 | .261 | .325 | .389 | .714 |
| 1982 | 539.3 | 60.6 | 126.1 | 11.3 | 57.0 | 10.6 | 71.0 | .261 | .324 | .389 | .713 |
| 1981 | 355.7 | 37.5 | 81.2 | 6.0 | 35.1 | 6.8 | 44.5 | .256 | .320 | .369 | .689 |
| 1980 | 522.6 | 58.5 | 123.7 | 10.0 | 54.9 | 10.7 | 65.5 | .265 | .326 | .388 | .714 |
| 1979 | 534.7 | 62.4 | 126.4 | 11.4 | 58.6 | 9.9 | 66.8 | .265 | .330 | .397 | .727 |
| 1978 | 534.5 | 57.9 | 122.6 | 9.9 | 54.1 | 10.1 | 67.4 | .258 | .323 | .379 | .702 |
| 1977 | 542.9 | 63.2 | 127.8 | 12.2 | 59.1 | 10.1 | 73.0 | .264 | .329 | .401 | .730 |
| 1976 | 525.7 | 55.2 | 119.7 | 8.0 | 51.2 | 10.9 | 66.8 | .255 | .320 | .361 | .681 |
| 1975 | 529.3 | 58.0 | 120.6 | 9.6 | 54.0 | 9.0 | 68.7 | .258 | .327 | .374 | .701 |
| 1974 | 536.7 | 57.9 | 122.5 | 9.6 | 53.6 | 9.0 | 70.3 | .257 | .324 | .369 | .693 |
| 1973 | 530.5 | 58.4 | 121.3 | 11.1 | 54.4 | 7.3 | 72.6 | .257 | .325 | .379 | .704 |
| 1972 | 502.2 | 49.2 | 109.2 | 9.1 | 45.8 | 6.5 | 74.4 | .244 | .311 | .354 | .664 |
| 1971 | 519.7 | 53.4 | 115.3 | 10.1 | 49.9 | 6.3 | 74.2 | .249 | .317 | .365 | .682 |
| 1970 | 538.5 | 60.9 | 121.0 | 12.4 | 56.8 | 6.9 | 80.7 | .254 | .326 | .385 | .711 |
| 1969 | 558.3 | 59.7 | 122.8 | 11.8 | 55.2 | 7.0 | 84.7 | .248 | .320 | .369 | .689 |
| 1968 | 521.3 | 47.9 | 110.9 | 8.6 | 44.5 | 6.5 | 82.6 | .237 | .299 | .340 | .639 |
| 1967 | 526.5 | 52.8 | 114.4 | 9.9 | 48.7 | 5.9 | 83.9 | .242 | .306 | .357 | .664 |
| 1966 | 535.3 | 56.7 | 119.7 | 12.1 | 52.8 | 6.4 | 82.7 | .249 | .310 | .376 | .686 |
| 1965 | 538.7 | 56.8 | 118.3 | 11.8 | 52.7 | 6.4 | 84.6 | .246 | .311 | .372 | .683 |
| 1964 | 536.1 | 57.2 | 120.6 | 12.0 | 53.3 | 5.1 | 83.7 | .250 | .313 | .378 | .690 |
| 1963 | 536.8 | 56.1 | 118.7 | 11.9 | 52.2 | 5.4 | 82.4 | .246 | .309 | .372 | .681 |
| 1962 | 552.3 | 64.1 | 126.5 | 13.3 | 60.1 | 6.0 | 77.9 | .258 | .326 | .393 | .719 |
| 1961 | 526.8 | 62.2 | 120.5 | 13.1 | 58.0 | 5.0 | 71.9 | .258 | .328 | .399 | .727 |
| 1960 | 514.3 | 57.9 | 116.3 | 11.5 | 54.1 | 5.0 | 69.5 | .255 | .324 | .388 | .712 |
| 1959 | 510.6 | 58.5 | 116.6 | 12.1 | 54.9 | 4.6 | 67.9 | .257 | .324 | .392 | .716 |
| 1958 | 505.9 | 56.8 | 116.2 | 12.0 | 53.5 | 4.0 | 65.7 | .258 | .325 | .394 | .719 |
| 1957 | 516.2 | 57.6 | 118.3 | 11.9 | 54.2 | 4.2 | 64.7 | .258 | .324 | .391 | .715 |
| 1956 | 530.7 | 61.5 | 120.7 | 12.8 | 57.6 | 4.0 | 64.1 | .258 | .331 | .397 | .729 |
| 1955 | 517.7 | 60.3 | 117.7 | 12.1 | 56.6 | 3.8 | 58.9 | .259 | .332 | .394 | .726 |
| 1954 | 534.9 | 60.6 | 122.7 | 10.8 | 56.9 | 3.9 | 57.2 | .261 | .333 | .390 | .723 |
| 1953 | 539.9 | 64.7 | 127.1 | 11.7 | 60.6 | 3.8 | 57.8 | .264 | .336 | .397 | .733 |
| 1952 | 518.7 | 56.6 | 116.4 | 9.3 | 52.9 | 4.2 | 56.8 | .253 | .327 | .370 | .696 |
| 1951 | 523.2 | 61.4 | 120.9 | 10.2 | 57.4 | 4.7 | 50.9 | .261 | .336 | .386 | .722 |
| 1950 | 536.9 | 66.9 | 125.6 | 11.5 | 62.7 | 3.6 | 53.2 | .266 | .346 | .402 | .748 |
| 1949 | 514.8 | 61.1 | 118.6 | 9.1 | 57.0 | 3.9 | 47.9 | .263 | .344 | .384 | .728 |
| 1948 | 522.8 | 61.8 | 121.4 | 8.5 | 57.8 | 4.4 | 49.2 | .263 | .341 | .382 | .723 |
| 1947 | 531.9 | 60.4 | 122.7 | 8.7 | 56.4 | 4.2 | 51.1 | .261 | .336 | .377 | .713 |
| 1946 | 487.8 | 51.1 | 110.6 | 6.2 | 47.2 | 4.5 | 49.7 | .256 | .328 | .360 | .688 |
| 1945 | 512.7 | 55.6 | 118.9 | 5.4 | 51.4 | 5.3 | 43.5 | .260 | .329 | .355 | .684 |
| 1944 | 528.5 | 57.2 | 123.3 | 5.7 | 52.9 | 5.1 | 45.2 | .260 | .326 | .358 | .684 |
| 1943 | 528.0 | 53.8 | 119.2 | 5.0 | 49.7 | 5.6 | 47.5 | .253 | .323 | .344 | .667 |
| 1942 | 526.6 | 56.0 | 118.7 | 6.0 | 51.5 | 5.4 | 46.7 | .253 | .323 | .350 | .674 |
| 1941 | 544.5 | 63.0 | 127.1 | 7.5 | 58.3 | 5.0 | 49.8 | .262 | .334 | .375 | .709 |
| 1940 | 545.6 | 65.8 | 130.9 | 8.9 | 60.9 | 5.4 | 51.5 | .267 | .334 | .392 | .726 |
| 1939 | 514.8 | 63.7 | 125.4 | 7.8 | 59.3 | 5.1 | 45.6 | .275 | .344 | .397 | .740 |
| 1938 | 547.2 | 68.7 | 133.7 | 8.5 | 64.5 | 5.1 | 47.8 | .274 | .343 | .396 | .739 |
| 1937 | 543.4 | 68.2 | 134.3 | 8.1 | 63.3 | 5.8 | 50.9 | .277 | .343 | .399 | .742 |
| 1936 | 563.4 | 73.9 | 143.1 | 7.9 | 68.7 | 5.5 | 47.4 | .284 | .349 | .404 | .753 |
| 1935 | 549.0 | 68.6 | 137.4 | 7.6 | 63.7 | 5.0 | 45.7 | .279 | .341 | .397 | .738 |
| 1934 | 534.5 | 67.1 | 134.0 | 7.5 | 62.7 | 5.1 | 47.2 | .279 | .342 | .397 | .738 |
| 1933 | 547.6 | 63.6 | 132.9 | 6.2 | 59.1 | 5.0 | 43.1 | .270 | .330 | .376 | .706 |
| 1932 | 544.5 | 68.3 | 135.9 | 7.7 | 63.6 | 5.6 | 44.4 | .277 | .337 | .400 | .737 |
| 1931 | 530.0 | 65.6 | 132.6 | 5.9 | 60.9 | 6.0 | 43.5 | .278 | .339 | .391 | .730 |
| 1930 | 538.3 | 75.8 | 141.7 | 8.7 | 70.6 | 6.0 | 43.9 | .296 | .356 | .434 | .790 |
| 1929 | 549.3 | 72.7 | 140.5 | 7.7 | 67.3 | 7.6 | 39.8 | .289 | .353 | .417 | .770 |
| 1928 | 528.3 | 64.4 | 131.2 | 6.0 | 59.4 | 7.0 | 39.2 | .281 | .344 | .397 | .741 |
| 1927 | 529.7 | 65.1 | 132.8 | 5.1 | 59.6 | 8.0 | 38.2 | .284 | .345 | .393 | .738 |
| 1926 | 529.1 | 63.6 | 130.7 | 4.8 | 58.1 | 7.1 | 37.7 | .281 | .345 | .389 | .733 |
| 1925 | 518.6 | 67.9 | 134.3 | 6.3 | 61.6 | 7.5 | 35.9 | .292 | .354 | .411 | .765 |
| 1924 | 527.2 | 64.8 | 134.3 | 5.0 | 58.7 | 8.3 | 36.7 | .287 | .348 | .394 | .742 |
| 1923 | 542.8 | 67.0 | 136.7 | 5.5 | 60.2 | 8.8 | 39.6 | .284 | .347 | .391 | .738 |
| 1922 | 552.9 | 69.3 | 141.5 | 6.1 | 62.0 | 8.3 | 40.0 | .288 | .348 | .401 | .749 |
| 1921 | 552.8 | 69.0 | 143.4 | 5.4 | 62.0 | 8.6 | 40.3 | .291 | .348 | .403 | .750 |
| 1920 | 544.4 | 61.9 | 133.9 | 3.6 | 53.8 | 9.9 | 41.7 | .276 | .335 | .372 | .707 |
| 1919 | 483.8 | 50.0 | 113.2 | 2.6 | 42.8 | 12.0 | 39.5 | .263 | .322 | .348 | .670 |
| 1918 | 431.1 | 41.9 | 97.0 | 1.3 | 35.2 | 11.3 | 33.6 | .254 | .317 | .325 | .642 |
| 1917 | 525.6 | 50.8 | 115.7 | 1.9 | 42.9 | 13.7 | 49.3 | .249 | .311 | .324 | .635 |
| 1916 | 517.8 | 49.8 | 113.6 | 2.1 | 42.1 | 15.4 | 53.4 | .248 | .312 | .326 | .638 |
| 1915 | 524.1 | 53.9 | 115.4 | 2.4 | 45.4 | 15.6 | 53.1 | .250 | .318 | .332 | .650 |
| 1914 | 524.0 | 54.8 | 117.4 | 2.7 | 46.1 | 17.3 | 55.7 | .254 | .321 | .337 | .659 |
| 1913 | 512.9 | 55.7 | 117.5 | 2.6 | 46.7 | 18.2 | 51.9 | .259 | .325 | .345 | .670 |
| 1912 | 513.7 | 61.5 | 121.5 | 2.4 | 51.5 | 18.7 | 25.5 | .269 | .337 | .359 | .695 |
| 1911 | 527.8 | 62.8 | 123.3 | 2.9 | 52.4 | 19.1 | 27.0 | .266 | .336 | .357 | .693 |
| 1910 | 525.1 | 54.2 | 115.1 | 2.0 | 44.5 | 18.5 | 25.0 | .249 | .318 | .326 | .644 |
| 1909 | 504.0 | 48.7 | 108.9 | 1.4 | 39.5 | 16.9 | 0.0 | .244 | .306 | .311 | .618 |
| 1908 | 519.9 | 48.3 | 110.7 | 1.5 | 39.2 | 15.7 | 0.0 | .239 | .297 | .305 | .602 |
| 1907 | 521.0 | 50.5 | 114.4 | 1.4 | 41.1 | 16.1 | 0.0 | .245 | .305 | .309 | .614 |
| 1906 | 514.9 | 51.0 | 113.4 | 1.5 | 41.7 | 17.2 | 0.0 | .247 | .306 | .314 | .621 |
| 1905 | 531.3 | 56.0 | 118.1 | 2.0 | 46.2 | 17.1 | 0.0 | .248 | .307 | .323 | .630 |
| 1904 | 534.2 | 54.6 | 119.4 | 1.9 | 44.5 | 16.3 | 0.0 | .247 | .301 | .321 | .622 |
| 1903 | 500.6 | 59.2 | 118.5 | 2.0 | 48.8 | 16.4 | 0.0 | .262 | .317 | .346 | .664 |
| 1902 | 497.1 | 58.4 | 120.0 | 2.1 | 48.7 | 15.8 | 0.0 | .267 | .322 | .344 | .665 |
| 1901 | 507.2 | 66.0 | 124.9 | 2.7 | 54.5 | 17.0 | 0.0 | .272 | .327 | .360 | .686 |
| 1900 | 504.3 | 68.8 | 126.7 | 2.9 | 57.1 | 19.6 | 0.0 | .279 | .339 | .366 | .705 |
| 1899 | 527.2 | 72.8 | 133.6 | 2.6 | 60.2 | 20.1 | 0.0 | .282 | .343 | .366 | .710 |
| 1898 | 549.9 | 71.8 | 133.3 | 2.4 | 60.0 | 16.3 | 0.0 | .271 | .334 | .347 | .681 |
| 1897 | 490.3 | 73.9 | 128.1 | 2.9 | 62.1 | 20.9 | 0.0 | .292 | .354 | .386 | .741 |
| 1896 | 485.6 | 74.6 | 125.9 | 3.2 | 62.7 | 23.9 | 27.5 | .290 | .354 | .387 | .741 |
| 1895 | 503.5 | 83.3 | 133.2 | 3.8 | 69.8 | 23.0 | 28.6 | .296 | .361 | .400 | .761 |
| 1894 | 517.3 | 95.0 | 143.8 | 5.1 | 80.5 | 25.3 | 26.9 | .309 | .379 | .435 | .814 |
| 1893 | 509.1 | 82.5 | 127.2 | 3.7 | 68.4 | 22.0 | 26.7 | .280 | .356 | .379 | .736 |
| 1892 | 552.6 | 73.5 | 122.3 | 3.3 | 57.6 | 25.0 | 46.7 | .245 | .317 | .327 | .644 |
| 1891 | 501.6 | 73.2 | 114.1 | 3.4 | 57.7 | 24.1 | 44.3 | .254 | .332 | .343 | .675 |
| 1890 | 487.3 | 74.7 | 113.7 | 2.9 | 56.8 | 26.5 | 25.4 | .260 | .337 | .351 | .688 |
| 1889 | 514.6 | 79.0 | 122.4 | 4.1 | 62.3 | 29.3 | 46.7 | .263 | .333 | .357 | .690 |
| 1888 | 472.8 | 62.0 | 105.1 | 3.0 | 46.9 | 30.7 | 23.3 | .239 | .291 | .320 | .611 |
| 1887 | 486.7 | 80.1 | 120.8 | 3.6 | 62.0 | 37.9 | 16.8 | .271 | .332 | .374 | .705 |
| 1886 | 470.3 | 68.7 | 107.3 | 2.5 | 49.2 | 19.4 | 25.4 | .246 | .303 | .332 | .634 |
| 1885 | 400.7 | 55.9 | 92.1 | 1.9 | 39.0 | 0.0 | 20.1 | .244 | .288 | .325 | .613 |
| 1884 | 355.1 | 51.8 | 82.3 | 2.1 | 15.2 | 0.0 | 13.4 | .243 | .279 | .327 | .606 |
| 1883 | 384.4 | 57.9 | 95.0 | 1.5 | 29.0 | 0.0 | 18.4 | .257 | .286 | .345 | .631 |
| 1882 | 314.0 | 44.3 | 75.1 | 1.3 | 24.2 | 0.0 | 15.7 | .248 | .276 | .330 | .606 |
| 1881 | 322.1 | 43.4 | 80.3 | 1.0 | 31.5 | 0.0 | 22.6 | .260 | .290 | .338 | .628 |
| 1880 | 320.3 | 40.8 | 76.1 | 0.8 | 28.4 | 0.0 | 25.5 | .245 | .267 | .320 | .587 |
| 1879 | 316.4 | 43.7 | 79.2 | 0.7 | 30.2 | 0.0 | 23.6 | .255 | .271 | .329 | .599 |
| 1878 | 250.2 | 34.0 | 63.2 | 0.4 | 23.8 | 0.0 | 19.3 | .259 | .279 | .319 | .598 |
| 1877 | 249.6 | 36.3 | 66.0 | 0.4 | 25.1 | 0.0 | 12.9 | .271 | .289 | .338 | .627 |
| 1876 | 272.5 | 40.8 | 71.1 | 0.5 | 26.4 | 0.0 | 7.8 | .265 | .277 | .321 | .598 |
Thursday, February 18, 2010
Sports: The Project
|
The quest begins to find the greatest 300 baseball players of all time. Step one: Find the very best.
I've worked on several projects covered by these very blog pages. I'm on a mission to embark on a much bigger one.
"The Project" is multi-layered. Many steps. May take months, if not longer.
The ultimate goal? Rank the top 300 offensive baseball players of all time.
The reason for this is pretty simple: I want a clearer view of the game's greatest. Cutting across eras, I want to answer some of the game's brain-numbing questions. Not necessarily to solve any global historical dilemma. Just for me. I expect to learn quite a bit from this exercise.
I want to be able to tell you who the greatest player of all time was and why. I want to be able to explain, with facts, why Willie Mays was better than Mickey Mantle (or vice versa).
I've gone through several scenarios in my head to determine how I would accomplish this. I keep coming back to one, simplified start:
Who is number one?
So we'll start with the very best baseball player of all time and go from there. Since I will need to consider several players to make the first declaration, my initial pool will help me make future declarations as well.
Who is number one? Well, I have my ideas. Probably rather obvious, but maybe not. Before I can make such a decision, I'd need to first narrow the field.
It's always important to make a such an analysis without bias, so I'm narrowing the field entirely based on strict statistical requirements.
.jpg) In order to qualify, a player must be retired and in the top 10 all time in career hits, home runs, or one of my recently developed peer-based qualitative categories: AVG, OBP, SLG, or OBP when taken as a ratio over the average player of their era. Note that I am only using Major League stats, so those who played part, most or all of their careers in the Negro League, for example, will have incomplete stats for this comparison. Only starring in The Natural will also not be enough to qualify.
In order to qualify, a player must be retired and in the top 10 all time in career hits, home runs, or one of my recently developed peer-based qualitative categories: AVG, OBP, SLG, or OBP when taken as a ratio over the average player of their era. Note that I am only using Major League stats, so those who played part, most or all of their careers in the Negro League, for example, will have incomplete stats for this comparison. Only starring in The Natural will also not be enough to qualify.
When I was done, I ended up with 32 players. Some will obviously not be the best ever player, but I want to make sure I don't miss anyone. And this also helps me set a field for the top five later on.
Here are the "prime" 32 (in alphabetical order by first name, thanks to Excel):
Babe Ruth
Barry Bonds
Billy Hamilton
Cap Anson
Carl Yastrzemski
Dan Brouthers
Eddie Collins
Frank Robinson
Hank Aaron
Hank Greenberg
Harmon Killebrew
Honus Wagner
Jimmie Foxx
Joe DiMaggio
Lou Gehrig
Mark McGwire
Mickey Mantle
Nap Lajoie
Paul Molitor
Pete Rose
Rafael Palmeiro
Reggie Jackson
Rod Carew
Rogers Hornsby
Sammy Sosa
Stan Musial
Ted Williams
Tony Gwynn
Tris Speaker
Ty Cobb
Willie Keeler
Willie Mays
And Babe Ruth is listed first! Funny that Willie Mays is last, too. Nice bookends, who will likely be on the short list of final names to consider. Purely coincidence, I promise.
Let me be clear about how these players will be analyzed. I will not give consideration to whether they are or are not eligible for the Hall of Fame. I will try very hard not to let use of performance enhancing drugs lead my decisions. And defensive position played means absolutely nothing in this analysis.
For the most part, everyone is on an equal playing field. That said, era will be considered -- which is what will make the era-based qualitative stats valuable. But totals will be part of the equation. I will also consider awards won, All-Star appearances, times led the league in categories, and overall dominance of one's era. A long, dominant career will be helpful, though not required.
What do you think? Is there an obvious number one player? Are there certain players we can immediately remove from this discussion?
I've worked on several projects covered by these very blog pages. I'm on a mission to embark on a much bigger one.
"The Project" is multi-layered. Many steps. May take months, if not longer.
The ultimate goal? Rank the top 300 offensive baseball players of all time.
The reason for this is pretty simple: I want a clearer view of the game's greatest. Cutting across eras, I want to answer some of the game's brain-numbing questions. Not necessarily to solve any global historical dilemma. Just for me. I expect to learn quite a bit from this exercise.
I want to be able to tell you who the greatest player of all time was and why. I want to be able to explain, with facts, why Willie Mays was better than Mickey Mantle (or vice versa).
I've gone through several scenarios in my head to determine how I would accomplish this. I keep coming back to one, simplified start:
Who is number one?
So we'll start with the very best baseball player of all time and go from there. Since I will need to consider several players to make the first declaration, my initial pool will help me make future declarations as well.
Who is number one? Well, I have my ideas. Probably rather obvious, but maybe not. Before I can make such a decision, I'd need to first narrow the field.
It's always important to make a such an analysis without bias, so I'm narrowing the field entirely based on strict statistical requirements.
.jpg)
When I was done, I ended up with 32 players. Some will obviously not be the best ever player, but I want to make sure I don't miss anyone. And this also helps me set a field for the top five later on.
Here are the "prime" 32 (in alphabetical order by first name, thanks to Excel):
Babe Ruth
Barry Bonds
Billy Hamilton
Cap Anson
Carl Yastrzemski
Dan Brouthers
Eddie Collins
Frank Robinson
Hank Aaron
Hank Greenberg
Harmon Killebrew
Honus Wagner
Jimmie Foxx
Joe DiMaggio
Lou Gehrig
Mark McGwire
Mickey Mantle
Nap Lajoie
Paul Molitor
Pete Rose
Rafael Palmeiro
Reggie Jackson
Rod Carew
Rogers Hornsby
Sammy Sosa
Stan Musial
Ted Williams
Tony Gwynn
Tris Speaker
Ty Cobb
Willie Keeler
Willie Mays
And Babe Ruth is listed first! Funny that Willie Mays is last, too. Nice bookends, who will likely be on the short list of final names to consider. Purely coincidence, I promise.
Let me be clear about how these players will be analyzed. I will not give consideration to whether they are or are not eligible for the Hall of Fame. I will try very hard not to let use of performance enhancing drugs lead my decisions. And defensive position played means absolutely nothing in this analysis.
For the most part, everyone is on an equal playing field. That said, era will be considered -- which is what will make the era-based qualitative stats valuable. But totals will be part of the equation. I will also consider awards won, All-Star appearances, times led the league in categories, and overall dominance of one's era. A long, dominant career will be helpful, though not required.
What do you think? Is there an obvious number one player? Are there certain players we can immediately remove from this discussion?
Wednesday, February 17, 2010
Technology: Keeping the Dirt out of Twitter
|
It's been about six months now, and my use of Twitter continues to develop. One thing I decided very early on was to keep my use "clean." In other words, don't lie, deceive, scam, spam or pad numbers.
In the beginning, it wasn't clear what was and wasn't Kosher. I wasn't sure how to use the service, so I read countless guides and "guru" advice articles. Of course, that wasn't necessarily a good idea.
But over time, I've decided not to do any of the following:
 I'm sure there are other tactics I'm missing. Basically, if it doesn't feel right -- if it feels spammy or sleazy -- I'm not doing it.
Some of these are obvious, some are used by respected people. It's not about the "right" or "wrong" way to use Twitter. Maybe you do one or more of these things. Maybe there is an ethical way to use them effectively. To me, I'm just not comfortable doing them.
With that said, there are some gray areas that I'm grappling with. The current ethical dilemma I'm dealing with is the use of lists.
My perception of lists has evolved over time. In the beginning, I saw lists as a potential game changer that could alter the way that we looked at Twitter stats. Even after tempering my enthusiasm a few days later, I viewed lists as a major ego factor that could affect how we viewed profiles.
However, I made an observation in my first post about this subject that still sticks with me:
Now, technically, you can follow 1,000,000 people but focus only on the people you want to hear from.
I guess this is good and bad. It's good as a nice organizational tool. It's bad since you can now follow a large group of people with no intention of reading their stuff. You can bet that someone -- Twitter or a third party -- will provide the ability to make a list your default view.
In other words, you could follow 50,000 people but only pay attention to 100 of them. Once again, lessens the value of "number of followers" since following inflates your numbers.
Bingo. It's exactly what bothers me about lists to this day.
Look at it this way: When someone follows you, you hope that they are actually reading your updates. You value them as an audience. However, if you discovered that they never read a single one of your posts and only follow you because you are following them, would your view of that relationship change?
It's obvious to me why people would do this. Personally, I rarely unfollow someone who follows me. It will happen occasionally, but it's rare. So if you follow everyone who follows you, you are bound to do a great job of retaining followers. When that happens, your numbers can spike quickly.
For me, growth has been very gradual. But make no mistake, my number of followers increases most quickly when I follow people.
I made a bunch of lists in the beginning. I still think it's cool when people add me to their lists. But I don't use my lists. To me, it's just a way to show appreciation. It's had no other value, no other useful application for my daily use.
Making a Big Deal about Nothing?
It's possible I'm missing a key angle. It's possible I'm overreacting to how lists are used.
For example, maybe you follow 10,000 people and focus on 100. That said, you still respond to the other 9,900 if they reply you. Is that an acceptable use of lists? Granted, you still never read anything they publish in their feed that doesn't mention you.
Or maybe you focus 90% of your time on a list and the other 10% you will read through some of the "other" posts. Would this be acceptable? Or would it need to be 50/50? Where is the line drawn (if there is one)?
There's only a dilemma because of potential reward. We all know what happens if you decide to follow a ton of people. If you make the proactive follow, you'll get followed back by a decent percentage of people. Those people are likely to remain loyal because it is a reciprocal relationship (at least on the surface). Likewise, those followers you follow back are likely to remain loyal for the same reasons.
If there were no reward for this activity, I would think nothing of it. But I fear that there is something unnatural about the resultant growth. That said, if I choose to only follow a designated 150 or so people, I've predetermined my future audience (since I am not famous, of course).
And ultimately, we all want to increase our audience. So what do you think? Is focusing on a list that isolates 10% (or maybe less) of the people you follow ethical? Where is the line drawn?
In the beginning, it wasn't clear what was and wasn't Kosher. I wasn't sure how to use the service, so I read countless guides and "guru" advice articles. Of course, that wasn't necessarily a good idea.
But over time, I've decided not to do any of the following:
- Auto-follow those who follow me
- Auto-Direct Message those who follow me
- Send any DM spam, automated or not
- Follow hundreds of people at a time to get numbers, then unfollow those who didn't follow me back
- Use automated replies that respond to keywords with a script response
Some of these are obvious, some are used by respected people. It's not about the "right" or "wrong" way to use Twitter. Maybe you do one or more of these things. Maybe there is an ethical way to use them effectively. To me, I'm just not comfortable doing them.
With that said, there are some gray areas that I'm grappling with. The current ethical dilemma I'm dealing with is the use of lists.
My perception of lists has evolved over time. In the beginning, I saw lists as a potential game changer that could alter the way that we looked at Twitter stats. Even after tempering my enthusiasm a few days later, I viewed lists as a major ego factor that could affect how we viewed profiles.
However, I made an observation in my first post about this subject that still sticks with me:
Now, technically, you can follow 1,000,000 people but focus only on the people you want to hear from.
I guess this is good and bad. It's good as a nice organizational tool. It's bad since you can now follow a large group of people with no intention of reading their stuff. You can bet that someone -- Twitter or a third party -- will provide the ability to make a list your default view.
In other words, you could follow 50,000 people but only pay attention to 100 of them. Once again, lessens the value of "number of followers" since following inflates your numbers.
Bingo. It's exactly what bothers me about lists to this day.
Look at it this way: When someone follows you, you hope that they are actually reading your updates. You value them as an audience. However, if you discovered that they never read a single one of your posts and only follow you because you are following them, would your view of that relationship change?
It's obvious to me why people would do this. Personally, I rarely unfollow someone who follows me. It will happen occasionally, but it's rare. So if you follow everyone who follows you, you are bound to do a great job of retaining followers. When that happens, your numbers can spike quickly.
For me, growth has been very gradual. But make no mistake, my number of followers increases most quickly when I follow people.
I made a bunch of lists in the beginning. I still think it's cool when people add me to their lists. But I don't use my lists. To me, it's just a way to show appreciation. It's had no other value, no other useful application for my daily use.
Making a Big Deal about Nothing?
It's possible I'm missing a key angle. It's possible I'm overreacting to how lists are used.
For example, maybe you follow 10,000 people and focus on 100. That said, you still respond to the other 9,900 if they reply you. Is that an acceptable use of lists? Granted, you still never read anything they publish in their feed that doesn't mention you.
Or maybe you focus 90% of your time on a list and the other 10% you will read through some of the "other" posts. Would this be acceptable? Or would it need to be 50/50? Where is the line drawn (if there is one)?
There's only a dilemma because of potential reward. We all know what happens if you decide to follow a ton of people. If you make the proactive follow, you'll get followed back by a decent percentage of people. Those people are likely to remain loyal because it is a reciprocal relationship (at least on the surface). Likewise, those followers you follow back are likely to remain loyal for the same reasons.
If there were no reward for this activity, I would think nothing of it. But I fear that there is something unnatural about the resultant growth. That said, if I choose to only follow a designated 150 or so people, I've predetermined my future audience (since I am not famous, of course).
And ultimately, we all want to increase our audience. So what do you think? Is focusing on a list that isolates 10% (or maybe less) of the people you follow ethical? Where is the line drawn?
Subscribe to:
Posts (Atom)